
US Flight Disruption Wave: 3,235 Delays and 143 Cancellations Hit Boston, New York, Phoenix, and Major Hubs

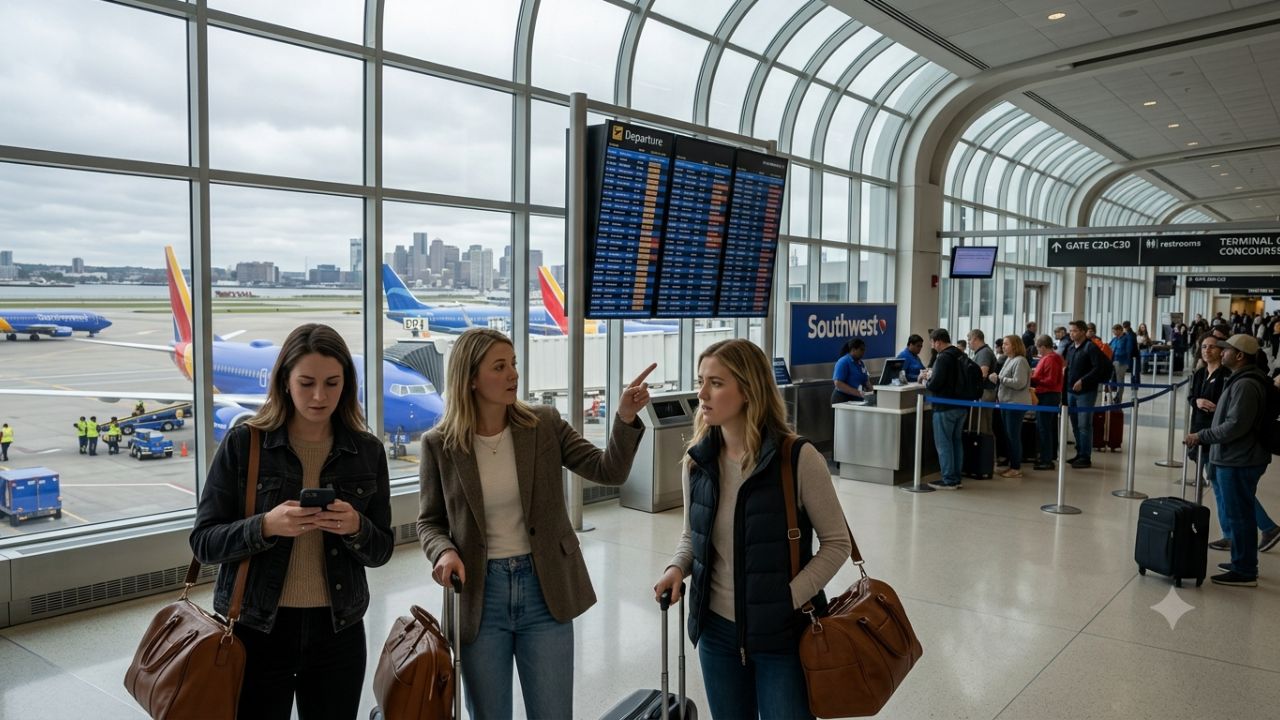
A volatile convergence of low cloud ceilings, desert thunderstorms, air traffic volume, and federal equipment outages triggered widespread aviation disruptions across the United States, producing 3,235 flight delays and 143 cancellations that heavily impacted hubs in Boston, New York, Phoenix, San Diego, and Los Angeles.
Commercial air travel across North America experienced acute operational friction as major domestic airlines and airport authorities struggled against cascading schedule delays. Federal Aviation Administration (FAA) traffic management initiatives—ranging from complete ground stops to multi-hour ground delay programs—were activated across multiple air traffic control corridors. The disruption ripple touched legacy carriers and low-cost operators alike, leaving tens of thousands of travelers navigating missed connections, extended terminal hold times, and aircraft turnarounds constrained by tight flight crew duty-hour limits.
From the dense airspace of the Northeast megalopolis to high-volume Western runways, the day's flight logs illustrated how localized meteorological challenges and isolated technological failures rapidly amplify across tightly interconnected airline networks.
The National Disruption Picture: Core Airport Hotspots
Flight tracking metrics compiled during peak transit hours revealed concentrated disruptions across key commercial aviation gateways. Boston Logan International Airport registered the highest aggregate delays and cancellations in the country, driven by deteriorating marine air masses and low ceilings. Simultaneously, New York's primary domestic and transcontinental hubs—LaGuardia, John F. Kennedy International, and Newark Liberty—absorbed substantial schedule slippage, while mid-continent and western gateways encountered acute ground management holds.
The following data table outlines the operational impact recorded across the most affected US passenger airports:
| Airport & IATA Code | Flight Delays | Departures Delayed (%) | Arrivals Delayed (%) | Flight Cancellations | Primary Disruption Factor / FAA Advisory |
|---|---|---|---|---|---|
| Boston Logan (BOS) | 433 | 25% | 36% | 37 | Low cloud ceilings (FAA Ground Delay, avg. 75 mins) |
| San Diego International (SAN) | 277 | Data Pending | 34% | 3 | Air traffic saturation (FAA Ground Delay, avg. 58 mins) |
| New York LaGuardia (LGA) | 252 | 25% | 22% | 6 | Northeast airspace congestion and terminal gate sequencing |
| Phoenix Sky Harbor (PHX) | 180 | 8% | 10% | 3 | Convective thunderstorms (FAA Ground Stop implemented) |
| Raleigh-Durham International (RDU) | 169 | 28% | 26% | 9 | Air traffic equipment outage (FAA Ground Delay, avg. 115 mins) |
| Los Angeles International (LAX) | 139 | 6% | 9% | 11 | Marine layer flow control and transpacific arrival metering |
| New York John F. Kennedy (JFK) | 121 | 7% | 11% | 8 | Airfield flow constraints and international connecting turns |
| Fort Lauderdale-Hollywood (FLL) | 93 | 19% | 10% | 5 | Convective coastal weather and apron staging queues |
| Newark Liberty International (EWR) | 92 | 7% | 8% | 7 | Runway construction flow spacing and terminal turns |
| Austin-Bergstrom International (AUS) | 57 | 6% | 7% | 1 | High surface wind shear (FAA Ground Stop implemented) |
Boston Logan: Northeast Focal Point of Schedule Breakdown
Boston Logan International Airport (BOS) bore the heaviest disruption burden among US facilities, logging 433 delays alongside 37 outright cancellations. More than a third (36%) of all scheduled arriving flights were delayed, while 25% of departing aircraft left well behind timetable.
The primary catalyst was stubborn low cloud ceilings settling over Massachusetts Bay, which forced air traffic controllers to widen lateral and longitudinal separation intervals for aircraft flying instrument approach procedures (ILS). Because Logan operates closely spaced parallel and intersecting runways, reduced visual minimums substantially diminish the airfield's acceptance rate. The FAA enacted a formal Ground Delay Program that averaged 75 minutes of airborne and gate-held delay per affected aircraft, disrupting high-frequency shuttle corridors connecting Boston to Washington, New York, and Chicago.
New York Tristate Airspace: LaGuardia, JFK, and Newark Under Pressure
The dense airspace surrounding the New York metropolitan area experienced severe operational friction:
- LaGuardia Airport (LGA): Recorded 252 delays and 6 cancellations, with 25% of departures and 22% of arrivals delayed. Due to perimeter rules and slot-controlled operations, any departure delay at LaGuardia instantly produces gate gridlock, as arriving aircraft cannot deplane passengers until delayed departing flights push back into taxi alleys.
- John F. Kennedy International (JFK): Suffered 121 delayed flights and 8 cancellations, disproportionately impacting long-haul widebody operations and domestic feed connections for Delta Air Lines and JetBlue Airways.
- Newark Liberty International (EWR): Logged 92 delays and 7 cancellations, complicating mid-day connecting banks for United Airlines' transcontinental schedules.
Because these three hubs share departure and arrival fixes managed by the New York Air Route Traffic Control Center (ZNY) in Ronkonkoma, air traffic management initiatives implemented for one airport immediately generate holding patterns and reroutes across the others.
Western Gateways: San Diego Volume Holds and Phoenix Thunderstorms
In Southern California, San Diego International Airport (SAN) accumulated 277 delays and 3 cancellations, with 34% of arriving flights held back. Operating as the busiest single-runway commercial airfield in the United States, San Diego has zero operational buffer when arrival volume spikes. The FAA issued a Ground Delay Program citing runway capacity and air traffic volume, generating an average inbound delay of 58 minutes.
Further inland, Phoenix Sky Harbor International Airport (PHX) confronted rapid convective activity as unseasonal desert thunderstorms swept across the Salt River Valley. Lightning, downdrafts, and low-level turbulence forced the FAA Air Traffic Control System Command Center to order an immediate Ground Stop, holding all PHX-bound departures at their origin airports. While cancellations remained contained at 3 flights, 180 departures and arrivals were delayed, snarling major connecting banks for American Airlines and Southwest Airlines.
Equipment Failures and Meteorological Outliers: Raleigh-Durham and Austin
A unique operational disruption occurred in North Carolina, where Raleigh-Durham International Airport (RDU) experienced 169 flight delays and 9 cancellations. Unlike purely weather-induced hold programs, RDU's operations were severely crippled by an unscheduled federal air traffic control equipment outage. The technical malfunction forced controllers to dramatically restrict airport arrival rates, triggering an FAA ground delay averaging 115 minutes per flight—the longest average delay duration among all affected US facilities.
In Central Texas, Austin-Bergstrom International Airport (AUS) encountered strong, shifting surface crosswinds that prompted a precautionary FAA ground stop, resulting in 57 delays and 1 flight cancellation as ground handlers halted ramp pushbacks during the highest wind gusts.
Carrier Impact: Fleet Networks and Operational Exposure
The nationwide ripple of 3,235 flight delays impacted major airline networks unevenly, depending on hub geography, fleet scheduling density, and turnaround margins.
The table below summarizes flight disruption figures across leading US carriers:
| Operating Airline | Total Delayed Flights | Delay Rate (% of Daily Schedule) | Total Cancelled Flights | Cancellation Rate (%) | Primary Operational Challenges |
|---|---|---|---|---|---|
| Southwest Airlines | 664 | 16% | 9 | 0.2% | Linear point-to-point network rotations, San Diego and Phoenix delays |
| Delta Air Lines | 337 | 9% | 8 | 0.2% | Boston Logan focus-city hold programs, New York slot sequencing |
| United Airlines | 245 | 7% | 25 | 0.7% | High cancellation volume, Newark and Midwest connecting bank misconnects |
| JetBlue Airways | 212 | 22% | 20 | 2.1% | Heavy Northeast concentration, Boston and JFK ground delay exposure |
| SkyWest Airlines | 179 | 6% | 12 | 0.4% | Regional feeder aircraft displacement, crew rest timing at spoke airports |
Southwest Airlines: Point-to-Point Fleet Cascades
Southwest Airlines recorded the highest raw number of delayed flights nationwide, with 664 aircraft operating behind schedule. Southwest's scheduling architecture relies heavily on linear, multi-leg aircraft routings rather than traditional pure hub-and-spoke banks. Under this structure, a single Boeing 737 might fly from Baltimore to San Diego, continue to Phoenix, and finish in Austin.
When ground delay programs struck San Diego (277 delays), Phoenix (180 delays), and Austin (57 delays) on the same afternoon, Southwest aircraft suffered cumulative delays on consecutive flight legs. Because turnaround times between flights are scheduled tightly (often between 35 and 45 minutes), flight crews quickly exhausted statutory duty limits under FAA Part 117 rest regulations, necessitating crew swaps and compounding afternoon schedule slippage.
JetBlue Airways: Regional Concentration Multiplies Disruption Rate
While Southwest absorbed the highest absolute delay tally, JetBlue Airways registered the highest proportional impact, with 22% of its entire daily operating schedule delayed (212 flights) and 20 flights completely cancelled (2.1% cancellation rate).
JetBlue maintains primary operational bases at Boston Logan (BOS) and New York JFK, with substantial operations at Newark and Fort Lauderdale. Because every one of these airports was simultaneously subject to FAA ground delays, convective storms, or low-ceiling arrival spacing, JetBlue faced intense operational headwinds. Aircraft awaiting inbound slots into Boston or New York spent hours held on distant taxiways, preventing ground crews from turning aircraft for evening departures.
United and Delta: Hub Buffer Strategies and Regional Feeder Dependencies
Legacy global carriers United Airlines and Delta Air Lines deployed contrasting operational strategies:
- United Airlines recorded 245 delays but logged 25 cancellations—the highest cancellation total among all major carriers. United opted for tactical, strategic cancellations on short-haul regional flights operating into Newark and Chicago to protect widebody transcontinental and international banks from running out of crew duty hours.
- Delta Air Lines limited cancellations to just 8 flights while absorbing 337 delays (9% of its network). Delta's extensive operations at Boston Logan felt direct pressure from the 75-minute ground delay program, but robust aircraft sparing and crew reserves at nearby New York and Atlanta helped prevent secondary network unraveling.
- SkyWest Airlines, operating regional feed under contract for United Express, Delta Connection, and American Eagle, registered 179 delays and 12 cancellations. Regional carriers often bear the brunt of tactical ground delay metering, as FAA controllers prioritize mainline widebody aircraft over smaller regional jets during peak flow restrictions.
Understanding FAA Traffic Management Initiatives (TMIs)
When airspace or airport capacity degrades, the FAA Air Traffic Control System Command Center in Warrenton, Virginia, coordinates with regional TRACONs (Terminal Radar Approach Control) and local towers to implement Traffic Management Initiatives. Travelers frequently experience these measures without understanding how they function:
FAA AIR TRAFFIC MANAGEMENT HIERARCHY
| GROUND STOP | GROUND DELAY PROGRAM | |
|---|---|---|
| • Immediate full halt | • Metered flow control | |
| • Flights held at origins | • Assigns Expected Dep Time | |
| • Used for severe hazards | • Manages sustained volume | |
| • Examples: Thunderstorms at | • Examples: Low ceilings BOS, | |
| PHX, High winds at AUS | saturation at SAN |
Ground Stop vs. Ground Delay Program
- Ground Stop (GS): The most acute tool available to traffic managers. It immediately halts all departures bound for a designated airport from leaving their origin gates. Ground stops are implemented during dynamic, rapidly evolving hazards such as severe convective activity over airport runways (as observed at Phoenix Sky Harbor), dangerous microburst wind shear (Austin-Bergstrom), or catastrophic runway blockages. Ground stops typically last from 30 minutes to two hours and are re-evaluated in real time.
- Ground Delay Program (GDP): Used when airport capacity is reduced for a prolonged, predictable duration—such as foggy low cloud ceilings (Boston Logan) or runway construction (Newark). Under a GDP, flights bound for the constrained airport are assigned an Expected Departure Clearance Time (EDCT) at their origin city, forcing the delay to occur on the ground rather than having dozens of airliners circle overhead in expensive and fuel-draining holding patterns.
- Miles-in-Trail (MIT) Restrictions: Controllers increase the mandatory radar separation between consecutive aircraft entering a specific sector of airspace (e.g., expanding spacing from 5 nautical miles to 20 or 30 nautical miles). This meters traffic entering congested airspace like the New York corridor.
Passenger Rights, DOT Mandates, and Airline Obligations
Widespread flight disruptions place severe demands on passenger rights and consumer protections. Navigating cancellations and multi-hour delays requires a clear understanding of current federal Department of Transportation (DOT) mandates and carrier tariff-of-carriage rules.
Controllable vs. Uncontrollable Delays
Federal regulations establish a sharp legal distinction between delays deemed controllable by the airline and those caused by external phenomena:
- Uncontrollable Delays (Force Majeure): Weather disruptions (low ceilings at Boston, lightning in Phoenix, crosswinds in Austin) and FAA equipment outages (such as RDU's technical fault) are legally categorized as events outside airline control. In these situations, airlines are not federally mandated to provide complimentary hotel accommodations, meal vouchers, or cash compensation.
- Controllable Delays: Mechanical breakdowns, internal IT system glitches, maintenance delays, or flight crew scheduling errors are categorized as controllable. Under DOT customer service commitments, major US carriers have pledged to provide complimentary meal vouchers for controllable delays exceeding three hours, and hotel accommodations with ground transportation for overnight controllable stranding.
Automatic Refund Mandates
Regardless of whether a cancellation is triggered by severe weather or internal airline mechanics, every passenger holds the federal right to a full cash refund if their flight is cancelled or significantly altered and they choose not to travel.
- Under DOT rules, if an airline cancels a flight and the passenger rejects the offered rebooking or alternate routing, the carrier must refund the unused portion of the ticket to the original form of payment within 7 business days (for credit card purchases) or 20 days (for cash payments).
- Airlines are legally prohibited from forcing travelers to accept travel credits, expiring vouchers, or frequent flyer miles in lieu of a direct monetary refund when the passenger demands cash.
| Disruption Type | Minimum Delay Threshold | Airline Legal Obligation (Weather / FAA Hold) | Airline Legal Obligation (Controllable / Maintenance) | Passenger Legal Recourse |
|---|---|---|---|---|
| Complete Flight Cancellation | Immediate upon cancellation | Rebook on next available flight OR issue full cash refund | Rebook on next available flight, provide hotel if overnight, OR cash refund | Entitled to complete cash refund if travel is declined |
| Extended Runway / Gate Tarmac Delay | 3 hours (domestic) / 4 hours (international) | Provide food, water, operating restrooms, medical care, and return to gate | Provide food, water, operating restrooms, medical care, and return to gate | DOT fines levied against airline for violating tarmac rules |
| Severe Schedule Delay | Exceeding 3 hours domestic | Rebook on subsequent flight; complimentary amenities not mandated | Provide meal vouchers; rebook on partner carrier where applicable | Request refund if passenger decides not to proceed with trip |
| Missed Connection (Separate Tickets) | Any duration | Downstream airline is not responsible for missed flight | Downstream airline is not responsible for missed flight | Travel insurance claim or standby fee negotiation |
Strategic Survival Guide: How Travelers Can Navigate Schedule Meltdowns
When 3,000+ flights are delayed nationwide, standard customer service channels—including airport ticket counters and telephone call centers—quickly become overwhelmed with wait times often exceeding several hours. Travelers can employ proven tactical measures to protect their journeys:
1. Leverage Multi-Channel Rebooking Technologies
When a flight cancellation occurs, avoid waiting in long concourse customer service queues. Instead, deploy simultaneous communication channels:
- Airline Mobile App Rebooking Tools: Modern carrier applications automatically generate alternative flight options within minutes of an official delay or cancellation. Travelers can select alternate routings, modify dates, or confirm new flights directly on their smartphones without speaking to a representative.
- Airport Self-Service Kiosks: Airside kiosks can scan boarding passes and display real-time seat availability across connecting hubs faster than manual agent processing.
- International Airline Support Lines: If US phone support lines show multi-hour holds, use VoIP services to dial the airline's overseas English-speaking customer support desks in the United Kingdom, Australia, or Singapore, where call queues are often negligible.
2. Monitor FAA Operational Feeds Directly
Airlines frequently post schedule changes in their consumer apps 30 to 60 minutes after federal traffic management programs are published. Travelers can check the official FAA Air Traffic Control System Command Center operational status page (nasstatus.faa.gov) to view active ground stops, ground delays, and arrival metering rates in real time.
If an incoming aircraft is originating from an airport currently subject to a Ground Delay Program (such as Boston Logan or San Diego), passengers can anticipate arrival delays long before the gate display reflects the delay.
3. Identify Alternate Co-Terminal Airports
In congested multi-airport metroplexes, flexibility regarding destination airports can rescue travel plans:
- New York Metropolitan Area: If a flight into LaGuardia (LGA) is cancelled, evaluate seat availability into John F. Kennedy (JFK), Newark Liberty (EWR), Westchester County (HPN), or Long Island MacArthur (ISP).
- Southern California: When San Diego (SAN) faces volume holds or Los Angeles (LAX) experiences flow control, consider flights routed into John Wayne Airport in Orange County (SNA), Ontario International (ONT), or Hollywood Burbank (BUR).
- South Florida: If Fort Lauderdale (FLL) encounters coastal weather holds, investigate Miami International (MIA) or Palm Beach International (PBI).
4. Baggage and Checked Luggage Precautions
During severe schedule disruptions, checked baggage routing systems suffer acute strain. When passengers are rebooked onto alternative flights across different connecting hubs, bags frequently fail to transfer:
- Travel with essential medications, electronics, chargers, and one change of clothes in a carry-on bag.
- Place digital tracking devices (such as Apple AirTags or Samsung SmartTags) inside checked baggage to track luggage location independently of airline barcode scans.
- If an itinerary is disrupted before departure, request gate agents to offload checked bags if an extended overnight delay occurs.
5. Document All Out-of-Pocket Expenses
For passengers holding travel insurance policies or credit cards with built-in trip delay protection (typically activating after 6 to 12 hours of delay):
- Retain timestamped boarding passes, airline cancellation notices, and official email advisories.
- Secure itemized receipts for hotel rooms, ground transportation (taxis or rideshares), and meals purchased during the delay window.
- Request an official written delay verification letter (military excuse / insurance verification letter) via the operating carrier's website to substantiate insurance claims.
Outlook for US Aviation Infrastructure and Airspace Resiliency
The widespread schedule disruptions across America's commercial air network highlight persistent vulnerabilities within contemporary aviation infrastructure. While airline fleets are operating at near-record seat capacity, air traffic control staffing shortages at key regional TRACONs, aging terminal facilities, and extreme weather volatility leave little operational margin for error.
As airlines continue investing in predictive flight dispatching software and the FAA modernizes radar infrastructure through the NextGen satellite air traffic management transition, resolving bottlenecks at single-runway choke points like San Diego and high-density terminal corridors like Boston and New York remains an urgent national priority. Until long-term runway expansions and redundant air traffic routing systems are fully realized, travelers flying through primary US hubs must remain proactive, equipped with real-time flight tracking tools, and prepared to adapt to dynamic schedule adjustments.
Related Travel Guides
Disclaimer
This article is for informational and educational purposes only. It does not constitute legal, financial, or professional advice. While we strive to provide accurate and up-to-date information, travel policies, regulations, and conditions change rapidly. Always verify information with official sources before making travel decisions. Nomad Lawyer makes no representations about the accuracy, reliability, completeness, or suitability of the information provided. Readers should consult qualified professionals for advice specific to their circumstances. The views expressed in this article are those of the author and do not necessarily reflect the views of Nomad Lawyer.
Raushan Kumar
Founder & Lead Developer
Full-stack developer with 11+ years of experience and a passionate traveller. Raushan built Nomad Lawyer from the ground up with a vision to create the best travel and law experience on the web.
Learn more about our team →