
US Flight Disruptions: Over 4,180 Delays and 225 Cancellations Hit Las Vegas, Phoenix, and Charlotte
Federal tracking reveals 4,182 delays and 225 cancellations across US airports, with Southwest logging 1,034 delays amid severe wind and ground hold programs.

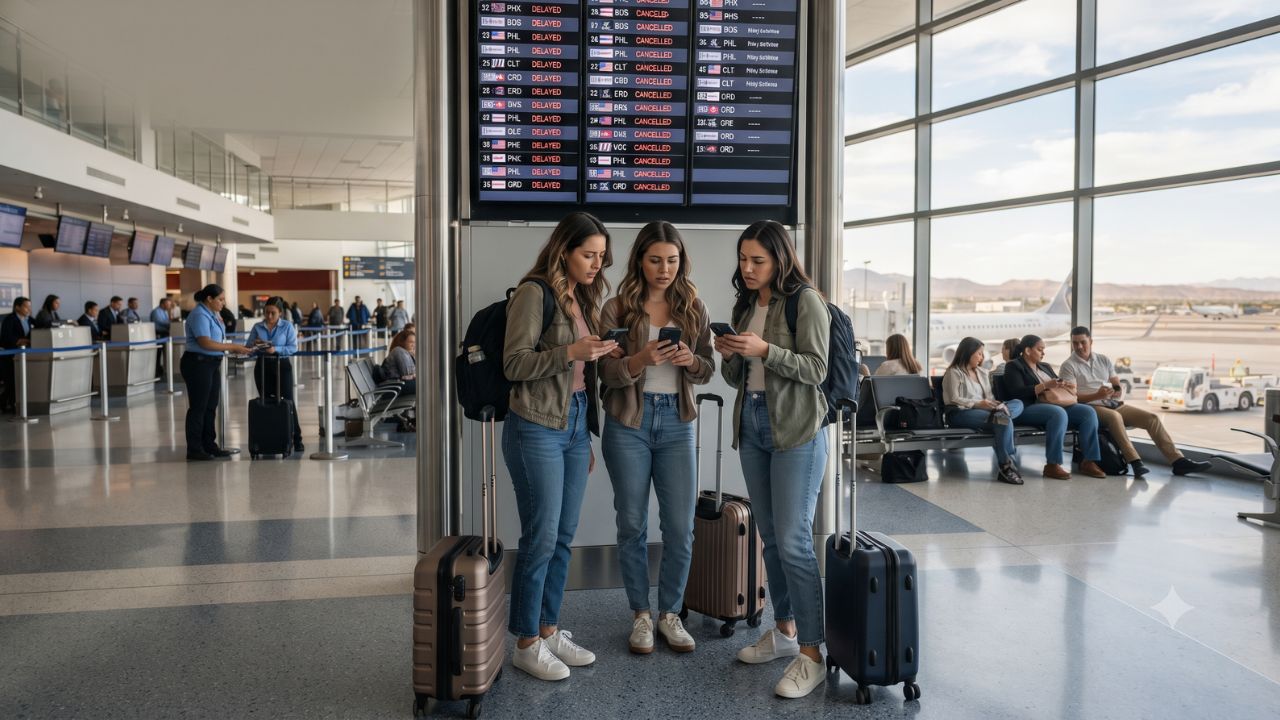
Image generated by AI
A national wave of 4,182 flight delays and 225 cancellations grounded air travelers across the United States on October 11, 2026, as Southwest Airlines absorbed 1,034 delayed departures—representing 23 percent of all delayed flights nationwide. Verified tracking records captured at 2:39 pm ET by aviation data provider FlightAware revealed severe operational stress radiating from desert hubs in Nevada and Arizona to coastal terminals in Charlotte, Boston, and Philadelphia.
The widespread schedule breakdown exposed structural vulnerabilities in the domestic airspace network. While severe winter storms typically trigger widespread ground stops, autumn disruptions often stem from localized wind shears, low cloud ceilings, and planned runway rehabilitation intersecting with rigid airline scheduling banks. As regional delays cascaded through point-to-point networks, thousands of passengers faced missed connections and stranded baggage.
Meteorological and Infrastructure Pressure Points Across the Hub System
The operational bottleneck developed along multiple geographic axes. Charlotte/Douglas International Airport recorded the highest raw delay count in the country, tallying 458 delays and 11 cancellations. As American Airlines' premier Southeastern connecting hub, the airfield saw 27 percent of outbound flights and 25 percent of inbound arrivals running behind schedule, overwhelming gate allocations and regional baggage transfer operations.
Out west, desert wind conditions severely constricted runway throughput. Phoenix Sky Harbor International Airport posted 425 delays and 23 cancellations, governed by a mandatory Federal Aviation Administration (FAA) ground delay program that pushed average holds to 83 minutes. Strong surface crosswinds forced air traffic controllers to expand arrival spacing, driving departure delays to 27 percent and arrival disruptions to 28 percent.
Concurrently, Harry Reid International Airport in Las Vegas registered the nation's steepest cancellation tally, scratching 45 flights while recording 417 delays. The FAA instituted departure delay advisories in Las Vegas of 15 minutes and increasing due to severe desert gusting, which impacted 24 percent of outbound flights and 25 percent of inbound operations.
Along the Atlantic seaboard, low cloud ceilings and civil engineering projects created compounding gridlock. Boston Logan International Airport recorded 255 delays and 16 cancellations, burdened by an FAA ground delay program averaging 70 minutes caused by active runway construction. Philadelphia International Airport experienced low atmospheric ceilings, triggering a 66-minute ground delay initiative that drove 248 delays and 11 cancellations. At Ronald Reagan Washington National Airport, low ceilings generated departure delays of 15 minutes and increasing, causing 271 delays, three cancellations, and an arrival delay rate of 22 percent.
In New York, John F. Kennedy International recorded 161 delays and nine cancellations under traffic management and weather programs, while LaGuardia absorbed 111 delays and two cancellations. Miami International reported 108 delays and five cancellations, while smaller regional terminals in Florida's Panhandle experienced heavy schedule cuts: Pensacola logged 13 delays and seven cancellations, while Eglin AFB/Destin–Fort Walton Beach suffered 11 cancellations against just 12 delays, cutting 14 percent of departures.
Comprehensive Hub Impact: Disrupted US Airports on 11 October 2026
The table below illustrates the operational parameters, flight disruption volumes, and official FAA control initiatives recorded across major domestic air stations.
| Airport Name & Code | Delayed Flights | Canceled Flights | Official FAA Operational Advisory | Departure Delay % | Arrival Delay % |
|---|---|---|---|---|---|
| Charlotte/Douglas (CLT) | 458 | 11 | Unrestricted volume saturation | 27% | 25% |
| Phoenix Sky Harbor (PHX) | 425 | 23 | Ground delay program: 83 min avg, wind | 27% | 28% |
| Harry Reid, Las Vegas (LAS) | 417 | 45 | Departure delay: 15 min, increasing; wind | 24% | 25% |
| Reagan Washington National (DCA) | 271 | 3 | Departure delay: 15 min, increasing; low ceilings | — | 22% |
| Boston Logan (BOS) | 255 | 16 | Ground delay program: 70 min, runway work | 12% | 19% |
| Philadelphia (PHL) | 248 | 11 | Ground delay program: 66 min, low ceilings | 17% | 19% |
| Chicago O'Hare (ORD) | 244 | 13 | Network flow spacing | 7% | 11% |
| Dallas-Fort Worth (DFW) | 224 | 11 | Connecting bank holds | 9% | 8% |
| Los Angeles (LAX) | 183 | 15 | West Coast coastal spacing | 8% | 11% |
| John F. Kennedy, New York (JFK) | 161 | 9 | Departure delay: 15 min, increasing; traffic/weather | 8% | 14% |
| LaGuardia, New York (LGA) | 111 | 2 | Airspace volume management | — | — |
| Miami (MIA) | 108 | 5 | Departure delay: 15 min, increasing; traffic/weather | 7% | 8% |
| Pensacola (PNS) | 13 | 7 | Regional connector ground hold | 5% | — |
| Eglin AFB / Destin (VPS) | 12 | 11 | Gulf Coast runway sequencing | 14% | 13% |
Data compiled from verified FlightAware tracking snapshots and FAA System Command Center bulletins captured on October 11, 2026, at 2:39 pm ET.
Carrier Performance Breakdown: Fleet Exposure and Operating Models
The distribution of cancellations and schedule revisions varied sharply across domestic airlines, highlighting the differing vulnerabilities of point-to-point and hub-and-spoke operational models.
| Operating Airline | Recorded Delays | Recorded Cancellations | National Delay Share | Cancellation Share | Primary Network Vulnerability |
|---|---|---|---|---|---|
| Southwest Airlines | 1,034 | 32 | 23% | Normal | Point-to-point aircraft rotation across Phoenix & Vegas |
| American Airlines | 640 | 33 | 17% | Normal | Connecting bank congestion at Charlotte, Philly, & Dallas |
| Delta Air Lines | 374 | 20 | Normal | Normal | Coastal feeder delays and regional connecting holds |
| United Airlines | 293 | 17 | Normal | Normal | Hub holding patterns at Chicago O'Hare and Newark |
| SkyWest Airlines | 200 | 13 | Normal | Normal | Regional feed capacity constrained by major partner ground holds |
| Frontier Airlines | 117 | 11 | Normal | 1% | Out-of-base crew repositioning constraints |
| Allegiant Air | 108 | 12 | Normal | 2% | Low-frequency leisure routes vulnerable to aircraft swaps |
Southwest Airlines absorbed the heaviest disruption, reporting 1,034 delays and 32 cancellations. Because Southwest utilizes a point-to-point fleet rotation model with heavy aircraft circulation through Phoenix and Las Vegas, an 83-minute ground hold in Arizona cascades into delayed afternoon legs across Denver, Chicago Midway, and Baltimore. American Airlines followed with 640 delays and 33 cancellations, representing a 17 percent delay share driven by congestion at Charlotte and Philadelphia.
Legacy rivals Delta Air Lines and United Airlines recorded 374 delays (20 cancellations) and 293 delays (17 cancellations), respectively. Regional feeder SkyWest Airlines registered 200 delays and 13 cancellations, while ultra-low-cost operators Frontier Airlines (117 delays, 11 cancellations) and Allegiant Air (108 delays, 12 cancellations) absorbed elevated cancellation ratios of 1 percent and 2 percent, where single cancellations leave travelers without same-day rebooking options.
Expert Analysis: The Economic and Regulatory Realities of Rolling Ground Holds
For passengers navigating domestic air travel during multi-hub ground delay programs, the direct consequence is severe connection disruption paired with limited immediate carrier compensation. Under regulatory metrics established by the Bureau of Transportation Statistics (BTS), ground delay programs driven by high winds, low ceilings, or airport construction are categorized as air traffic control and weather events, insulating airlines from statutory cash compensation mandates.
The pricing pressure this creates on airline irregular operations (IROPS) means that carriers prioritize cancelling regional feeder flights over high-yield transcontinental trunk routes. Cancelling an American Eagle or SkyWest regional flight from Pensacola or Destin preserves runway slots and pilot duty hours for widebody flights between Charlotte, Dallas, and London. Consequently, travelers flying to or from secondary regional airports bear a disproportionate share of total flight cancellations.
Furthermore, passengers flying point-to-point carriers like Southwest face distinct recovery hurdles. In a hub-and-spoke system, an airline can swap out delayed flight crews from a central domicile. In a point-to-point network, flight crews remain paired with specific airframes throughout multi-city sequences. When an aircraft incurs an 83-minute ground hold in Phoenix, the crew's legal duty clock, governed strictly by FAA Part 117 rest regulations, frequently expires before the final evening leg. This triggers last-minute midnight cancellations when replacement crews cannot be repositioned in time.
Travelers must exercise proactive contractual protections. Federal Department of Transportation rules mandate that passengers are entitled to prompt cash refunds to their original payment method if an airline cancels a flight or significantly alters departure times and the passenger declines rebooking. Relying on automated mobile app rebooking algorithms often re-routes travelers onto secondary connections that are themselves subject to ground delay holds. Passengers should demand non-stop alternatives or consider interline transfers where applicable.
Key Takeaways
- Nationwide Gridlock Scope: The US aviation network absorbed 4,182 delays and 225 cancellations on 11 October 2026, driven by desert crosswinds and East Coast ground holds.
- Carrier Concentration: Southwest Airlines experienced the heaviest impact with 1,034 delays (23 percent national delay share), followed by American Airlines with 640 delays.
- Severe Airport Hold Times: Phoenix Sky Harbor endured 83-minute ground delay holds, while Boston Logan averaged 70 minutes and Philadelphia logged 66 minutes.
- Regional Stations Suffer Cancellations: Eglin AFB/Destin recorded 11 cancellations on just 12 delays, illustrating how carriers cancel regional feeders to preserve hub slots.
- Regulatory Rights: Weather- and air-traffic-induced disruptions exempt airlines from meal and hotel vouchers in many contracts, but travelers retain the legal right to a full refund upon cancellation.
FAQ: US Flight Disruptions October 2026
Which US airport experienced the highest flight cancellations on October 11, 2026?
Harry Reid International Airport in Las Vegas recorded the highest cancellation volume with 45 flights canceled, driven by high desert winds and departure control programs.
Why did Southwest Airlines record over 1,000 flight delays?
Southwest's point-to-point operational network passes heavily through Phoenix and Las Vegas, allowing morning wind delays in Arizona and Nevada to cascade into hundreds of downstream flights nationwide.
Are passengers entitled to cash refunds when flights are canceled due to weather or air traffic?
Yes. Under US Department of Transportation rules, passengers are legally entitled to a full cash refund to their original payment method if their flight is canceled or significantly altered and they decline rebooking.
What is the difference between an FAA ground delay program and a departure delay?
A ground delay program halts aircraft at their departure gates hundreds of miles away to pace arrivals into a constrained airport, whereas departure delays occur on active taxiways at the origin airport.
When desert winds collide with rigid airline networks, passenger survival depends on recognizing that a delay in Arizona can ground an evening connection in Boston.
Related Travel Guides
Delta Air Lines Flight Cancellations Warning Across US Hubs
10 Best Flight Delay Survival Tips for US Hubs, According To Reddit
Disclaimer
This article is for informational and educational purposes only. It does not constitute legal, financial, or professional advice. While we strive to provide accurate and up-to-date information, travel policies, regulations, and conditions change rapidly. Always verify information with official sources before making travel decisions. Nomad Lawyer makes no representations about the accuracy, reliability, completeness, or suitability of the information provided. Readers should consult qualified professionals for advice specific to their circumstances. The views expressed in this article are those of the author and do not necessarily reflect the views of Nomad Lawyer.
Kunal K Choudhary
Co-Founder & Contributor
A passionate traveller and tech enthusiast. Kunal contributes to the vision and growth of Nomad Lawyer, bringing fresh perspectives and driving the community forward.
Learn more about our team →