
US Flight Delays Surpass 3,800 as Thunderstorms Impact Major Hubs
Flight Aware data shows 401 cancellations and 3,834 delays across the US on August 9, 2026, with Chicago and Reagan National hardest hit.
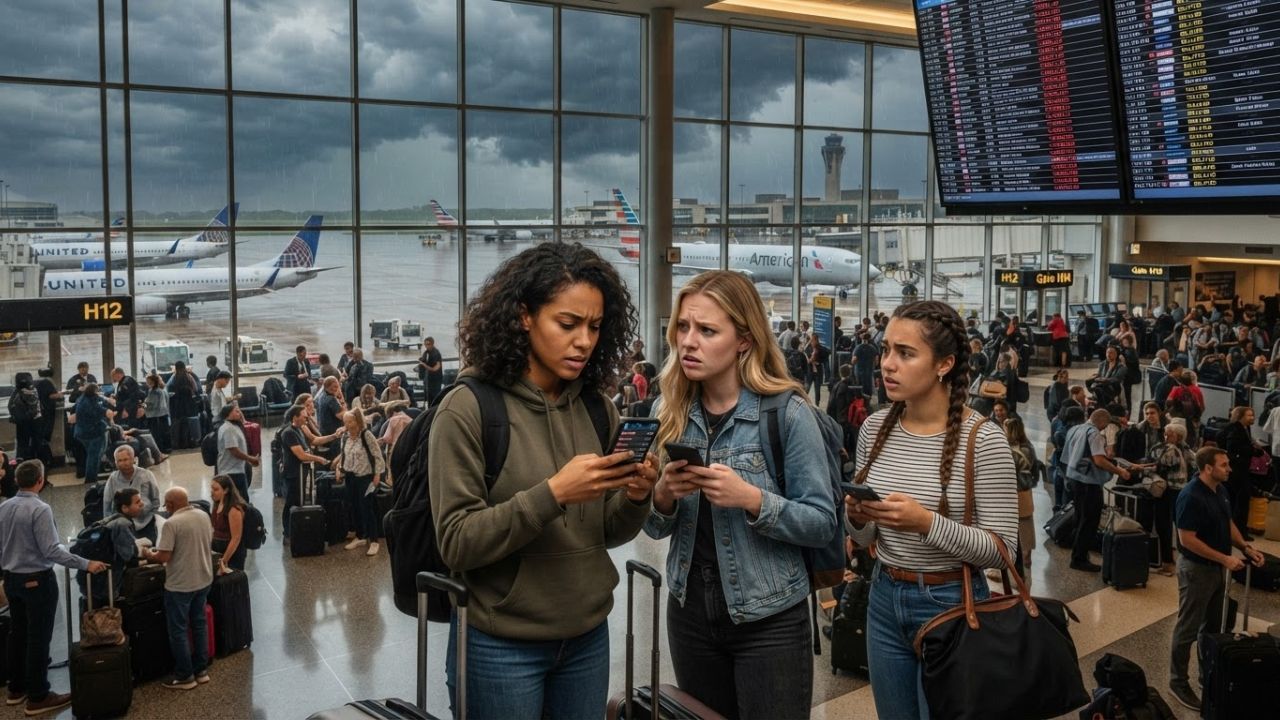
Image generated by AI
Convective weather and ground stops have triggered widespread disruptions across the United States, causing 3,834 delays and 401 cancellations on August 9, 2026.
The Core Transit Update
Domestic and international air corridors across the United States are facing widespread operational delays due to severe weather fronts and airport volume constraints. Real-time aviation figures compiled by FlightAware on August 9, 2026 (at 2:51 pm ET) reveal a national total of 401 cancellations and 3,834 flight delays.
Chicago O'Hare (ORD) emerged as the primary delay pressure point, following a Federal Aviation Administration (FAA) ground stop from 11:33 pm to 1:00 am GMT+5:30. In terms of cancellations, Reagan National Airport (DCA) recorded the highest volume nationwide, with 78 flights cancelled.
Airport & Airline Disruption Specifications
Navigating transit hubs during weather events requires tracking airport delays alongside specific airline performance metrics. The following tables outline the recorded metrics by airport and carrier.
| US Airport Hub | Airport Code | Recorded Delays | Recorded Cancellations | Primary Operational Constraint |
|---|---|---|---|---|
| Chicago O'Hare | ORD | 645 delays | 44 cancellations | Thunderstorms & ground stop (11:33 PM - 1:00 AM) |
| Dallas Fort Worth | DFW | 309 delays | 24 cancellations | Thunderstorm knock-on delays |
| Boston Logan | BOS | 274 delays | 33 cancellations | High East Coast traffic volume |
| New York JFK | JFK | 264 delays | 39 cancellations | Weather-related lane restrictions |
| Atlanta Hartsfield | ATL | 224 delays | 10 cancellations | Departure delays averaging 30+ mins |
| San Diego | SAN | 190 delays | 2 cancellations | Volume-related ground delay (avg 34 mins) |
| New York LaGuardia | LGA | 177 delays | 32 cancellations | High metropolitan area volume |
| Reagan National | DCA | 165 delays | 78 cancellations | Highest cancellation count nationwide |
| Philadelphia | PHL | 129 delays | 36 cancellations | Severe East Coast weather fronts |
| Detroit Metro | DTW | 129 delays | 18 cancellations | Knock-on scheduling delays |
| Nashville | BNA | 117 delays | 11 cancellations | Traffic management routing shifts |
| Charlotte Douglas | CLT | 110 delays | 64 cancellations | Airline regional fleet placement |
US airport delays and cancellations (August 9, 2026).
| Operating Airline Carrier | Recorded Flight Delays | Recorded Cancellations | Primary Disruption Character |
|---|---|---|---|
| Delta Air Lines | 354 delays | 8 cancellations | High delay count, low cancellation rate |
| United Airlines | 330 delays | 20 cancellations | Delay-driven hub operations |
| JetBlue | 306 delays | 63 cancellations | Moderately high cancellation share |
| Republic Airways | 182 delays | 32 cancellations | Regional network flow constraints |
| Envoy Air | 155 delays | 10 cancellations | Regional network flow constraints |
| PSA Airlines | 130 delays | 180 cancellations | Highest cancellations (exceeds delays) |
| Frontier Airlines | 59 delays | 12 cancellations | Niche route cancellation blocks |
US airline delay and cancellation statistics.
Traveler Logistics Guide
From a ground-level perspective, the best way to navigate this is to download the FAA's National Airspace System dashboard on your mobile device before arriving at the airport, as it logs active traffic management programs and average ground delay times in real time, often updating hours before airline apps reflect weather-related holding patterns. Checking weather radars is recommended.
To plan your journey under severe disruptions:
- Connection Layover Buffers: Increase your layover windows at major connecting hubs like Chicago O'Hare (ORD) or Dallas Fort Worth (DFW) to a minimum of 3 hours to absorb knock-on flight delays.
- Understand Carrier Rules: Under US Department of Transportation (DOT) guidelines, if your flight is cancelled or experiences a significant delay, you are entitled to a full refund to your original payment method, even on non-refundable tickets.
- Volume Ground Delays: If flying out of San Diego (SAN), expect average ground delays of 34 minutes due to localized airport volume, independent of weather conditions.
- Alternative Regional Rail: When traveling along the East Coast Corridor (e.g., between Washington DCA and New York JFK), utilize Amtrak’s Acela or regional rail networks to bypass airport ground holds.
Infrastructure Impact Assessment
The concentration of 3,834 delays highlights the vulnerability of US airspace during peak summer convective weather. Thunderstorms over the Midwest and East Coast trigger traffic management initiatives that limit runway capacity, forcing aircraft to hold in local airspace or wait on the ground.
By coordinating real-time route adjustments and utilizing regional ground networks, airports and airlines manage aircraft rotations, helping stabilize the national transport system until weather fronts clear.
Related Travel Guides
Delta Flight DL2307 Operating to Bismarck Diverts Back to Minneapolis
Shravani Mela 2026 Deoghar Travel Tips and Logistics Guide
10 Best Travel Tips for US Flight Disruptions, According to Reddit
Disclaimer
This article is for informational and educational purposes only. It does not constitute legal, financial, or professional advice. While we strive to provide accurate and up-to-date information, travel policies, regulations, and conditions change rapidly. Always verify information with official sources before making travel decisions. Nomad Lawyer makes no representations about the accuracy, reliability, completeness, or suitability of the information provided. Readers should consult qualified professionals for advice specific to their circumstances. The views expressed in this article are those of the author and do not necessarily reflect the views of Nomad Lawyer.