
USA Aviation Crisis 2026: 3,207 Flight Delays and 170 Cancellations Hit Chicago O'Hare and 11 Major Hubs
Severe weather and traffic volume triggered 3,207 delays and 170 cancellations across 12 major US airports, with Chicago O'Hare and PSA Airlines reporting the highest operational disruptions.

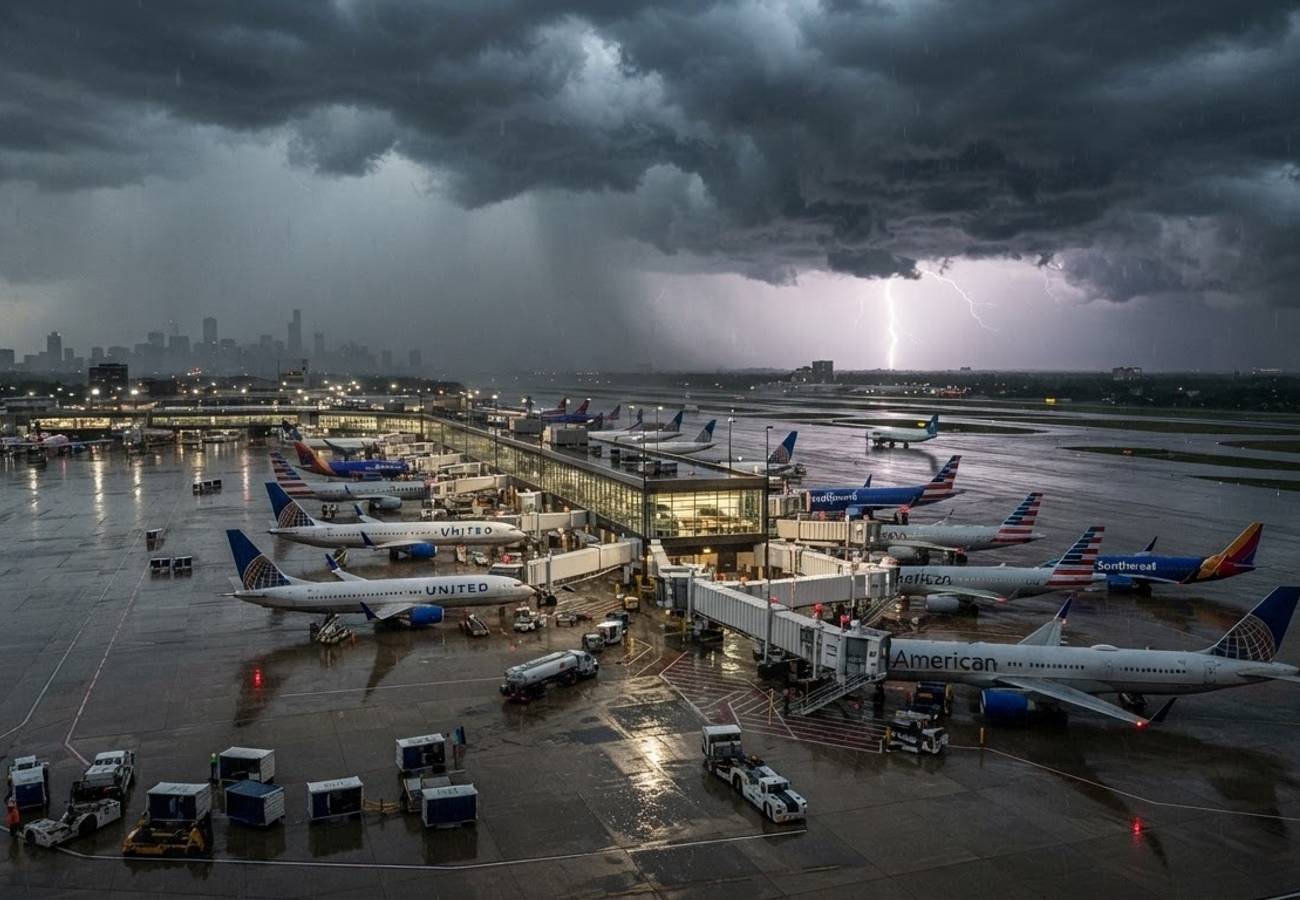
Image generated by AI
Severe weather and traffic congestion have triggered a systemic aviation disruption across the United States, resulting in 3,207 delays and 170 cancellations. Chicago O’Hare International Airport remains the epicenter of the crisis following a total ground stop.
Systemic Disruptions Across US Airspace
A wave of operational failures has swept through the US national airspace, impacting 12 major aviation hubs. The disruptions are a result of a combination of severe meteorological events and unsustainable traffic volumes, leading to significant bottlenecks in both domestic and international transit.
The Federal Aviation Administration (FAA) reported that thunderstorms in the Midwest necessitated a full ground stop at Chicago O’Hare International Airport. Simultaneously, the East and West Coasts faced visibility issues, with "low ceilings" forcing ground delays at Boston Logan and San Francisco International airports. In San Diego, the infrastructure struggled to keep pace with aircraft volume, creating a compounding delay effect for departing flights.
Airport-Specific Impact Data
The following data details the precise number of delays and cancellations recorded at the most affected hubs:
| Airport | Delays | Cancellations | Primary Cause of Disruption |
|---|---|---|---|
| Chicago O’Hare (ORD) | 351 | 5 | Thunderstorms / Ground Stop |
| San Diego (SAN) | 235 | 6 | Traffic Volume |
| San Francisco (SFO) | 235 | 8 | Low Ceilings (Avg. 51m delay) |
| Boston Logan (BOS) | 196 | 5 | Low Ceilings (Avg. 74m delay) |
| John F. Kennedy (JFK) | 153 | 34 | Operational Constraints |
| Philadelphia (PHL) | 149 | 25 | Operational Constraints |
Other airports reporting significant disruptions include Los Angeles International (LAX), which recorded 126 delays, as well as Newark Liberty, LaGuardia, and Ronald Reagan Washington National.
Airline Performance Metrics
While airport infrastructure suffered, specific carriers bore the brunt of the scheduling collapses. American Airlines recorded the highest volume of delays, though PSA Airlines saw the highest rate of total cancellations among the tracked carriers.
| Airline | Total Delays | Total Cancellations |
|---|---|---|
| American Airlines | 516 | 14 |
| Delta Air Lines | 237 | 20 |
| JetBlue | 145 | 21 |
| PSA Airlines | 135 | 31 |
Traveler Logistics Guide: Navigating Systemic Delays
From a ground-level perspective, the best way to navigate these disruptions is to stop relying on airport terminal screens, which often lag behind real-time FAA updates. When a ground stop is issued—as seen at O'Hare—aircraft are held at the gate or on the tarmac indefinitely; in these scenarios, checking your airline's mobile app for "aircraft rotation" updates is more effective than waiting for a gate agent.
Optimal Connection Strategies:
- The 4-Hour Rule: During periods of "low ceiling" warnings in Boston or San Francisco, ensure a minimum of 4 hours between connecting flights. The average delays of 51 to 74 minutes recorded in this event can easily snowball into missed connections.
- Digital Documentation: Keep PDF copies of your boarding passes and booking references offline. During mass disruptions, airport Wi-Fi networks often crash due to over-capacity, making cloud-based documents inaccessible.
- Rebooking Priority: If your flight is cancelled, use the airline's app to rebook before joining the physical customer service line. Digital queues are processed faster than terminal queues.
Customs and Transit Policies: For international travelers arriving at JFK or PHL during these delays, be aware that staffing levels at customs may not scale with the sudden influx of delayed passengers arriving simultaneously. This can lead to secondary queues at immigration.
Infrastructure Impact Assessment
This event highlights a critical vulnerability in US regional connectivity. When a primary hub like Chicago O'Hare enters a ground stop, the ripple effect is felt across the entire network. The "low ceiling" delays in Boston and San Francisco indicate that current instrument landing systems (ILS) at these hubs are still heavily susceptible to weather-induced capacity drops.
The disparity between American Airlines' high delay count (516) and PSA Airlines' high cancellation count (31) suggests a difference in operational strategy: major carriers are opting to hold passengers in delays, while regional partners are cancelling flights entirely to reset their schedules.
Real-time aviation data remains volatile; travelers should verify all status updates via official FAA channels.
Related Travel Guides
Disclaimer
This article is for informational and educational purposes only. It does not constitute legal, financial, or professional advice. While we strive to provide accurate and up-to-date information, travel policies, regulations, and conditions change rapidly. Always verify information with official sources before making travel decisions. Nomad Lawyer makes no representations about the accuracy, reliability, completeness, or suitability of the information provided. Readers should consult qualified professionals for advice specific to their circumstances. The views expressed in this article are those of the author and do not necessarily reflect the views of Nomad Lawyer.
Preeti Gunjan
Contributor & Community Manager
A passionate traveller and community builder. Preeti helps grow the Nomad Lawyer community, fostering engagement and bringing the reader experience to life.
Learn more about our team →