US Flight Disruptions: Over 1,440 Delays and 140 Cancellations Hit Dallas, Miami, and Chicago

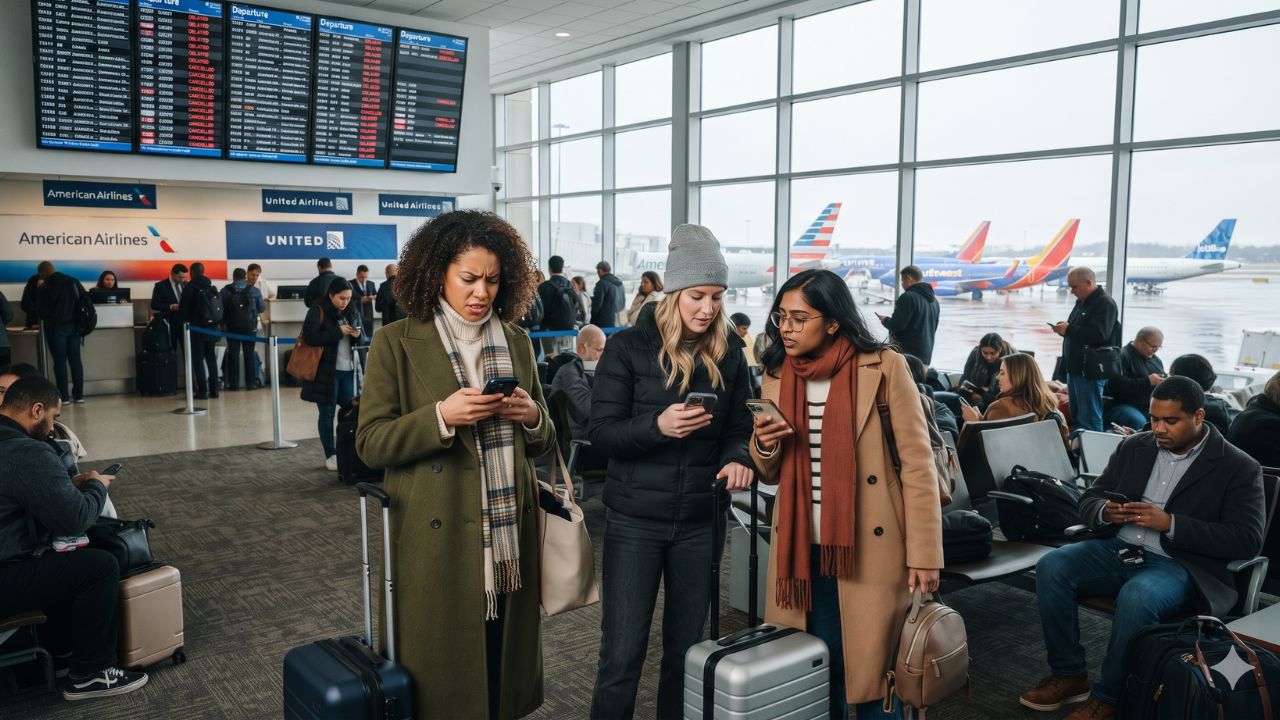
While major winter blizzards or severe convective squall lines are typically blamed for nationwide flight cancellations, relatively clear autumn weather across the United States on 3 November 2026 did not prevent a cascade of 1,442 delays and 141 cancellations from disrupting major transport hubs. Operating conditions unraveled as strong coastal crosswinds triggered Federal Aviation Administration ground-delay programs at San Francisco International Airport that averaged 114 minutes per aircraft, while active runway rehabilitation in Miami and air traffic control staffing constraints around New York produced compounding delays across the national airspace system overseen by the Federal Aviation Administration.
According to real-time aviation tracking data verified by FlightAware at 12:44 pm ET, the disruption impacted both trunk mainline carriers and regional feeders. American Airlines suffered 375 delayed flights—the highest of any airline in the country—while JetBlue Airways recorded 46 outright cancellations. From Dallas-Fort Worth to Chicago O'Hare, leisure holidaymakers and business commuters heading toward regional destinations promoted by Visit Dallas faced missed connections, crowded gate waiting areas, and revised departure estimates.
The 3 November Aviation Gridlock: Wind, Staffing, and Runway Upgrades
The operational bottleneck developed through a confluence of localized infrastructure restrictions and air traffic control management. In Northern California, Pacific wind gusts forced San Francisco International Airport (SFO) to restrict operations on its closely spaced parallel runways, producing 162 delayed flights and an FAA ground-delay program averaging nearly two hours per departure.
On the East Coast, the FAA issued operational advisories citing a 45-minute average departure delay at Teterboro Airport (TEB) in New Jersey due to regional air traffic staffing shortages. Further south, Miami International Airport (MIA) experienced average departure delays of 15 minutes attributed directly to scheduled runway construction, which collided with seasonal afternoon arrival banks to cause 142 delays and 30 cancellations. Concurrently, Phoenix Sky Harbor International Airport (PHX) registered departure delays averaging 15 minutes resulting from complex multiple-taxiway routing operations.
| Major US Airport Gateway | Airport Code | Confirmed Flight Cancellations | Confirmed Flight Delays | Operational Delay Rate (%) | Primary Root Cause Reported |
|---|---|---|---|---|---|
| Dallas-Fort Worth | DFW | 6 | 278 | 12% Departures / 12% Arrivals | Hub connection volume & network cascading |
| San Francisco International | SFO | 3 | 162 | High arrival queue | High coastal winds; 114-min FAA ground delay |
| Miami International | MIA | 30 | 142 | 13% Departures / 9% Arrivals | Scheduled runway construction & taxi queues |
| Chicago O’Hare | ORD | 9 | 120 | 4% Departures / 3% Arrivals | Volume sequencing and East Coast flow control |
| Fort Lauderdale-Hollywood | FLL | 35 | 58 | Concentrated leisure cancellations | Carrier network adjustments & flow management |
| New York LaGuardia | LGA | 6 | 58 | Dense northeast corridor flow | Regional staffing constraints & taxi holding |
| Washington Reagan National | DCA | 12 | 54 | Capital corridor flow control | Airspace sequencing & perimeter restrictions |
| Phoenix Sky Harbor | PHX | 1 | 48 | Taxiway sequencing hold | Multiple-taxiway ground operations |
| Nashville International | BNA | 7 | 45 | Mid-South network transfers | Turnaround delays from southern hubs |
| Boston Logan | BOS | 10 | 33 | Northeast regional connections | Inbound aircraft repositioning delays |
| Ted Stevens Anchorage | ANC | 8 | 29 | Northern Pacific transit | Cold-weather ground servicing sequencing |
Airport Impact Breakdown: Dallas, South Florida, and the Bay Area
Dallas-Fort Worth International Airport (DFW) emerged as the single most delayed airport in the nation, recording 278 delayed flights alongside 6 cancellations. As the primary global super-hub for American Airlines, DFW’s 12 percent departure and arrival delay rates generated extensive ripple effects across secondary airports in the South and Midwest. Incoming flights held on aprons caused inbound passengers to miss tight 40-minute domestic connection windows.
In South Florida, the disruption manifested primarily through flight cancellations. Fort Lauderdale-Hollywood International Airport (FLL) logged 35 cancellations—the highest terminal cancellation count in the United States—accompanied by 58 delays. Just 30 miles south, Miami International Airport logged 30 cancellations and 142 delays, driven by a 13 percent departure delay rate that backed up aircraft along terminal taxiways.
Meanwhile, Chicago O’Hare International Airport (ORD) demonstrated relative operational resilience despite processing heavy passenger volumes. O'Hare recorded 120 delays and 9 cancellations, maintaining an efficient 4 percent departure delay rate and 3 percent arrival delay rate, proving that Midwest airfield capacity remained stable even as coastal corridors slowed.
Airline Disruptions: American Airlines Delays vs. JetBlue Cancellations
The operational strain fractured along airline network models. American Airlines registered 375 delays and 34 cancellations, absorbing the brunt of ground hold programs at its Dallas-Fort Worth and Miami mega-hubs. Regional affiliate Envoy Air logged 44 delays and 6 cancellations, illustrating how regional connections feed into larger network delays.
JetBlue Airways experienced severe operational cancellations, leading all domestic airlines with 46 cancelled flights and 46 delayed flights. Because JetBlue maintains dense schedule concentrations in Fort Lauderdale, Boston Logan, and New York, runway constraints in Florida combined with Northeast staffing advisories caused rapid aircraft out-of-position rotations.
| US Airline Carrier | Scheduled Cancellations | Scheduled Delays | Network Model Impact | Operating Fleet Resilience |
|---|---|---|---|---|
| American Airlines | 34 | 375 | Hub-and-spoke congestion at DFW and MIA | Crew duty timeouts across long connecting banks |
| JetBlue Airways | 46 | 46 | Point-to-point East Coast and Florida routes | Concentrated cancellations in FLL and BOS |
| Southwest Airlines | 6 | 264 | Rolling point-to-point domestic network | Accumulated turnaround delays across secondary cities |
| United Airlines | 8 | 141 | Concentrated hub operations at ORD and SFO | SFO wind holding patterns delayed transcontinental flights |
| Envoy Air | 6 | 44 | Regional feeder routes connecting to DFW | Flow control restrictions held smaller regional jets |
| Alaska Airlines | 11 | 18 | West Coast trunk routes and Pacific corridors | SFO flow control and northern turnaround spacing |
Southwest Airlines recorded 264 delays but held cancellations to just 6 flights, demonstrating its ability to absorb rolling delays across secondary airports without canceling scheduled flying. United Airlines logged 141 delays and 8 cancellations, impacted primarily by holding patterns over San Francisco.
Visitor Insider Tips: Navigating US Hub Disruptions Like a Local
- Monitor FAA National Airspace Status Directly: Never rely solely on airline flight-status text messages, which often lag real-time airfield conditions by up to an hour. Consult the official Federal Aviation Administration Air Traffic Control System Command Center operational status page to see active ground delay programs and airport arrival rates before leaving for the airport.
- Master the DFW Skylink People Mover: If your connection at Dallas-Fort Worth is compressed due to arrival delays, do not exit security. Take the automated Skylink elevated train running every two minutes inside the secure area; a journey between Terminal A and Terminal D takes under nine minutes.
- Utilize the 24-Hour Rule and Airline Mobile Chat: Under consumer protection rules enforced by the US Department of Transportation, if your flight is cancelled or significantly delayed, you are legally entitled to a full cash refund rather than an expiring travel voucher. Use your airline app's in-app live chat or message agents via social media to rebook while standing in long terminal customer-service lines.
- Escape Miami Congestion via Concourse Train: At Miami International Airport, Concourse D stretches over a mile. Take the elevated Skytrain to reach gates D20 through D60 quickly, and stop at Cafe Versailles for an authentic Cuban espresso (cafecito) and warm guava pastry while monitoring gate changes.
- Take the CTA Blue Line from Chicago O’Hare: If your connection in Chicago is cancelled overnight, avoid expensive highway taxi queues along the Kennedy Expressway. Walk to the lower level of Terminal 2 to board the Chicago Transit Authority (CTA) Blue Line train, reaching downtown Chicago hotels in 45 minutes for $5.00.
Cultural and Environmental Context: Hub-and-Spoke Fragility and Airspace Congestion
The cascading delays across the United States highlight the structural vulnerabilities of the modern hub-and-spoke aviation model. To maximize aircraft utilization and passenger connectivity, airlines schedule hundreds of flights to arrive and depart within tightly compressed 60-minute windows. When a single external variable—such as crosswinds in San Francisco or concrete repairs on a single runway in Miami—delays a dozen aircraft, flight crews exceed statutory duty limits, causing subsequent flight legs across unrelated cities to collapse hours later.
From an environmental standpoint, chronic airspace delays carry a significant carbon penalty. When aircraft enter holding patterns over Northern California or idle on taxiways in Dallas and Miami awaiting departure slots, auxiliary power units and jet turbofans burn millions of gallons of aviation fuel while stationary. Modernizing air traffic management through NextGen satellite-based trajectory tracking and investing in airport ground infrastructure remain essential steps to cutting ground taxi emissions and building climate resilience across the American national airspace.
FAQ: US Flight Disruptions November 2026
What caused widespread flight delays across the USA on 3 November 2026?
Disruptions were triggered by 114-minute average wind delays at San Francisco, runway construction in Miami, air traffic control staffing constraints in New York, and cascading hub connections in Dallas.
Which airline suffered the most delays and cancellations?
American Airlines recorded the highest delay count with 375 delayed flights, while JetBlue Airways experienced the highest number of cancellations with 46 flights grounded.
Which airport experienced the highest number of delays?
Dallas-Fort Worth International Airport (DFW) led the nation with 278 delays, recording 12 percent delay rates for both departures and arrivals.
Am I entitled to a cash refund if my flight is cancelled?
Yes. Under US Department of Transportation regulations, passengers whose flights are cancelled or significantly delayed are legally entitled to a full cash refund if they choose not to travel.
[When autumn crosswinds and tight connection banks collide, patient preparation and smart transit hacks remain every traveler's best boarding pass.]
Related Travel Guides
This article is for informational purposes. Flight routes, passenger regulations, visa rules, and transit advisories are subject to change by airlines and aviation authorities. Readers are advised to verify schedules and travel documentation with relevant carriers and border agencies before departure.
Related Stories
Middle East Flight Alert: Over 1,100 Delays and 110 Cancellations Hit Dubai, Riyadh, and Dammam
Asia Flight Gridlock: Over 4,700 Delays and 640 Cancellations Hit Bangkok, Mumbai, and Makassar