
New York Drivers Lose 125 Hours Yearly as Worst US Rush-Hour Cities Revealed in 2026
A comprehensive study of 91 US cities reveals New York drivers lose 125 hours annually to rush-hour congestion, leading a list of the most traffic-burdened urban centers in America.

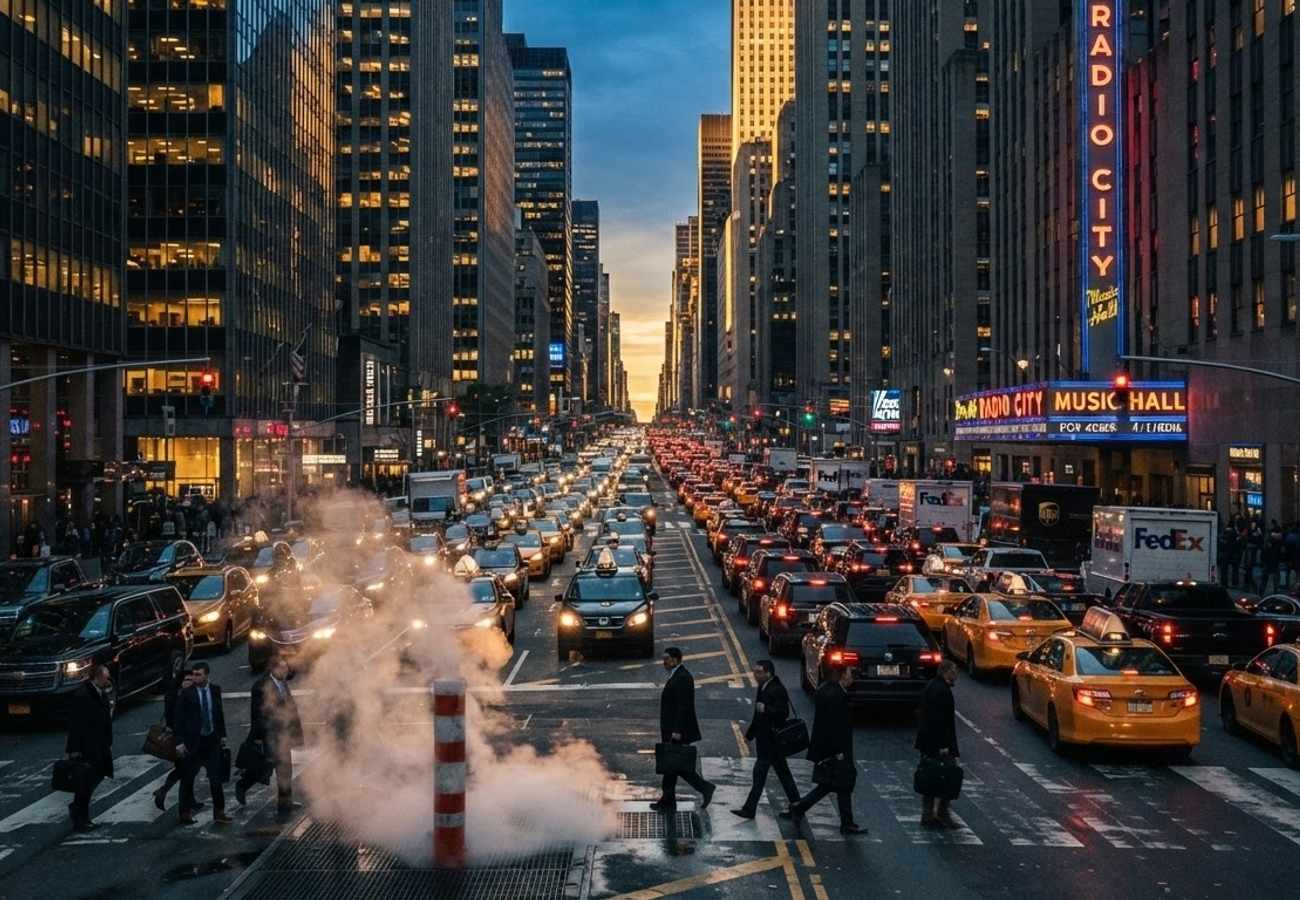
Image generated by AI
New York City drivers are losing more than five full days of their lives every year to peak-hour gridlock. A new analysis of 91 American cities reveals a staggering disparity in urban mobility, with some drivers losing 125 hours annually while others lose as few as 12.
The data, compiled by FLBR Motorsport, underscores a critical challenge for urban planning and travel logistics across the United States. For the modern traveler or digital nomad, these figures are more than just statistics; they represent significant delays in airport transfers, business appointments, and sightseeing efficiency.
New York Claims Top Spot in Annual Time Loss
New York City leads the nation in congestion, with drivers losing an estimated 125 hours per year during rush hour. This figure places the city nine hours ahead of its closest competitor, San Francisco, and 54 hours ahead of Baltimore, which ranks tenth.
The severity of New York's traffic is driven by a combination of an enormous commuter population and a rigid road infrastructure. The reliance on a limited number of bridges and tunnels to move millions of people creates a bottleneck effect that drastically inflates travel times.
For visitors, this means that a distance that appears short on a map can become a multi-hour ordeal during peak windows.
West Coast and Island Congestion Patterns
San Francisco follows in second place, with drivers losing 116 hours annually. The city's dense urban core and constrained geography make it a persistent hotspot for delays.
Surprisingly, Honolulu ranks third with 88 hours lost. While Hawaii's capital lacks the massive population of the mainland megacities, its unique geography and concentrated development create intense pressure on its limited road corridors. This is a vital consideration for tourists who may expect a relaxed pace but face significant delays when moving between resorts and attractions on Oahu.
Comparing Notorious Traffic Hubs: LA vs. New York
While Los Angeles is globally synonymous with traffic jams, it ranks fifth in this study with 83 hours lost. Interestingly, the data reveals that New York drivers lose 42 more hours annually than those in Los Angeles.
This disparity highlights a key insight: reputation does not always align with mathematical time loss. While LA may feel more consistently congested, the sheer volume and complexity of New York's peak-hour surges result in a higher annual time penalty.
Regional Congestion Trends Across the US
The study identifies several other major hubs where mobility is severely restricted:
- Boston (4th): 86 hours lost.
- Chicago (6th): 79 hours lost.
- The 72-Hour Tier: Miami, Philadelphia, and Washington, D.C. all tied for seventh place.
The consistency among these cities suggests that once a city reaches a certain threshold of population density and regional connectivity, congestion becomes an inevitable systemic issue. In Washington, D.C., this is exacerbated by the daily influx of government employees and lobbyists, while Miami's totals are driven by a mix of permanent residents and high-volume tourism.
Annual Time Lost During Rush Hour: Full City Rankings
The following data represents the annual hours lost to peak-hour congestion across 91 analyzed US cities.
| Rank | City | State | Time Lost (hrs) |
|---|---|---|---|
| 1 | New York | NY | 125 |
| 2 | San Francisco | CA | 116 |
| 3 | Honolulu | HI | 88 |
| 4 | Boston | MA | 86 |
| 5 | Los Angeles | CA | 83 |
| 6 | Chicago | IL | 79 |
| 7 | Miami | FL | 72 |
| 7 | Philadelphia | PA | 72 |
| 7 | Washington | DC | 72 |
| 10 | Baltimore | MD | 71 |
| 11 | Seattle | WA | 69 |
| 12 | Atlanta | GA | 61 |
| 12 | Pittsburgh | PA | 61 |
| 14 | Austin | TX | 60 |
| 14 | Providence | RI | 60 |
| 16 | Columbia | SC | 58 |
| 17 | Tampa | FL | 57 |
| 17 | Nashville | TN | 57 |
| 19 | Houston | TX | 56 |
| 19 | Dallas | TX | 56 |
| 21 | New Orleans | LA | 54 |
| 22 | San Jose | CA | 52 |
| 23 | Denver | CO | 51 |
| 23 | Portland | OR | 51 |
| 25 | Worcester | MA | 49 |
| 25 | Charlotte | NC | 49 |
| 25 | Allentown | PA | 49 |
| 28 | Charleston | SC | 48 |
| 28 | New Haven | CT | 48 |
| 30 | Oxnard | CA | 47 |
| 30 | Baton Rouge | LA | 47 |
| 30 | Boise | ID | 47 |
| 33 | Greenville | SC | 44 |
| 34 | Las Vegas | NV | 43 |
| 35 | Cape Coral | FL | 42 |
| 35 | Anchorage | AK | 42 |
| 37 | McAllen | TX | 40 |
| 37 | Indianapolis | IN | 40 |
| 39 | Riverside | CA | 39 |
| 39 | Fort Myers | FL | 39 |
| 39 | Long Beach | CA | 39 |
| 39 | Minneapolis | MN | 39 |
| 43 | Sacramento | CA | 38 |
| 43 | San Diego | CA | 38 |
| 45 | Anaheim | CA | 37 |
| 45 | Portland | ME | 37 |
| 45 | Milwaukee | WI | 37 |
| 48 | Phoenix | AZ | 34 |
| 49 | Richmond | VA | 33 |
| 50 | Louisville | KY | 31 |
| 50 | Jacksonville | FL | 31 |
| 50 | Columbus | OH | 31 |
| 50 | Birmingham | AL | 31 |
| 54 | El Paso | TX | 30 |
| 54 | Fort Worth | TX | 30 |
| 54 | Saint Louis | MO | 30 |
| 54 | Syracuse | NY | 30 |
| 58 | Ventura | CA | 29 |
| 58 | Tucson | AZ | 29 |
| 58 | Orlando | FL | 29 |
| 58 | Raleigh | NC | 29 |
| 58 | Albuquerque | NM | 29 |
| 58 | Cincinnati | OH | 29 |
| 58 | San Antonio | TX | 29 |
| 65 | Greensboro | NC | 28 |
| 65 | Detroit | MI | 28 |
| 67 | Colorado Springs | CO | 26 |
| 67 | Buffalo | NY | 26 |
| 69 | Knoxville | TN | 25 |
| 69 | Rochester | NY | 25 |
| 71 | Virginia Beach | VA | 24 |
| 71 | Salt Lake City | UT | 24 |
| 71 | Cleveland | OH | 24 |
| 71 | Grand Rapids | MI | 24 |
| 75 | Bakersfield | CA | 21 |
| 75 | Winston-Salem | NC | 21 |
| 75 | Kansas City | MO | 21 |
| 78 | Thousand Oaks | CA | 20 |
| 78 | High Point | NC | 20 |
| 78 | Oklahoma City | OK | 20 |
| 81 | Fresno | CA | 19 |
| 81 | Memphis | TN | 19 |
| 81 | Little Rock | AR | 19 |
| 84 | Mesa | AZ | 17 |
| 84 | Des Moines | IA | 17 |
| 86 | Dayton | OH | 16 |
| 87 | Akron | OH | 15 |
| 88 | Omaha | NE | 14 |
| 89 | Tulsa | OK | 12 |
| 89 | Wichita | KS | 12 |
| 89 | Council Bluffs | IA | 12 |
Key Takeaways
- New York's Dominance: At 125 hours lost annually, NYC is the most congested city in the US for rush-hour travel.
- The Top 10 Average: Drivers in the ten worst-affected cities lose an average of 86.4 hours per year.
- Geography vs. Population: Honolulu's high ranking (3rd) proves that limited road corridors can cause extreme delays even in smaller populations.
- Wide Distribution: Significant congestion is not limited to the coasts; cities like Atlanta (61 hrs) and Dallas (56 hrs) show deep inland mobility issues.
FAQ
Which US city has the worst rush-hour traffic according to the 2026 study? New York City ranks first, with drivers losing an average of 125 hours per year.
How does Los Angeles compare to New York in terms of time lost? Despite its reputation, Los Angeles ranks fifth with 83 hours lost annually, which is 42 hours fewer than New York.
Are smaller cities also affected by rush-hour congestion? Yes. The study analyzed 91 cities, showing that while some lose only 12 hours, others like Honolulu (88 hours) face severe delays despite having smaller populations than the largest US metros.
Planning your next US trip? Check the peak-hour data to avoid losing your vacation to a gridlocked highway.
Related Travel Guides
Disclaimer
This article is for informational and educational purposes only. It does not constitute legal, financial, or professional advice. While we strive to provide accurate and up-to-date information, travel policies, regulations, and conditions change rapidly. Always verify information with official sources before making travel decisions. Nomad Lawyer makes no representations about the accuracy, reliability, completeness, or suitability of the information provided. Readers should consult qualified professionals for advice specific to their circumstances. The views expressed in this article are those of the author and do not necessarily reflect the views of Nomad Lawyer.
Raushan Kumar
Founder & Lead Developer
Full-stack developer with 11+ years of experience and a passionate traveller. Raushan built Nomad Lawyer from the ground up with a vision to create the best travel and law experience on the web.
Learn more about our team →