
Flights Cancelled Swept America As Boston, Los Angeles, and Other Airports Face 175 Cancellations And 3,979 Delays, Affecting Air Travel
Flights Cancelled Swept America As Boston, Los Angeles, and Other Airports Face 175 Cancellations And 3,979 Delays, Affecting Air Travel

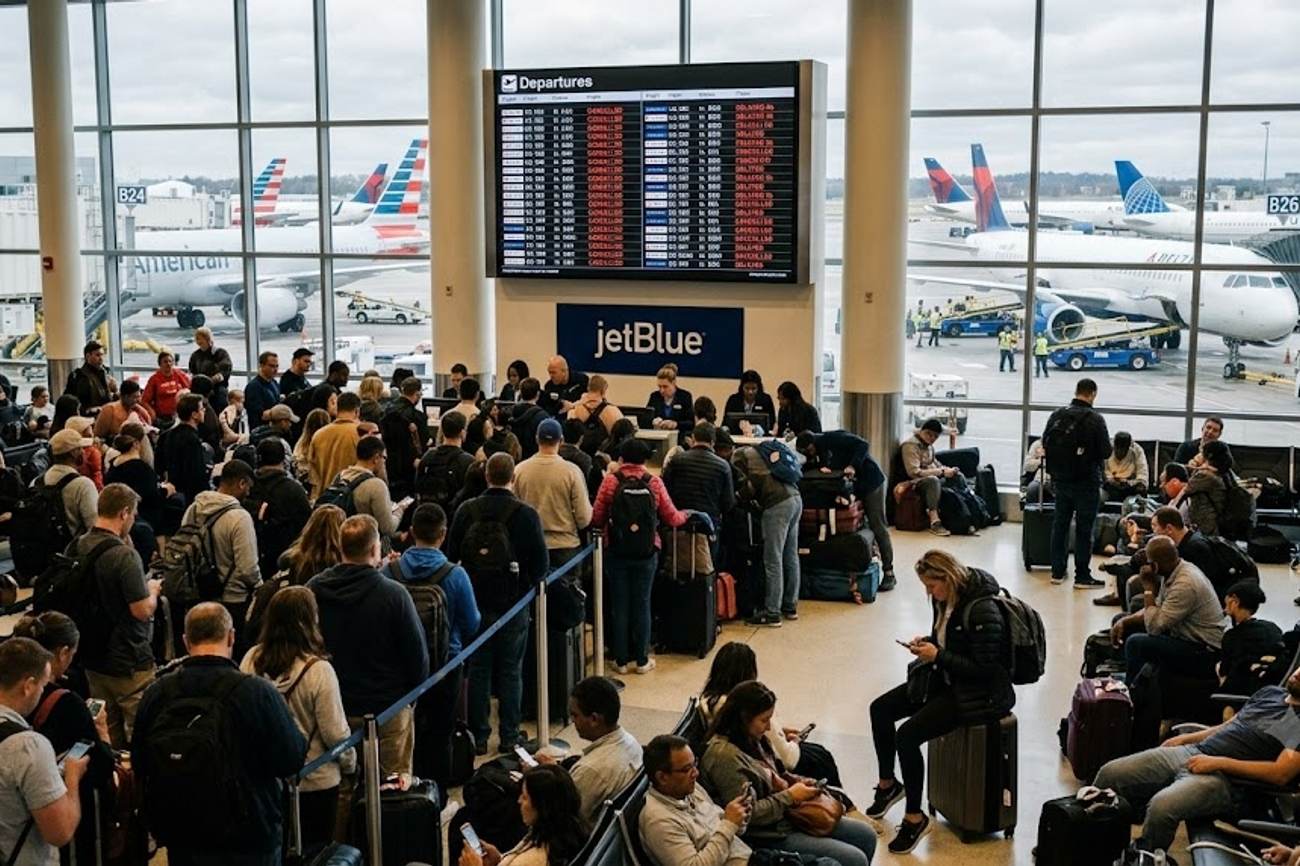
Image generated by AI
3,979 flight delays and 175 cancellations across the United States on September 14, 2026, have triggered a systemic operational failure across several of the nation's primary aviation hubs. This surge in disruption highlights a fragile equilibrium in the current US airspace, where a combination of infrastructure degradation and volatile weather patterns is creating a cascading effect on passenger itineraries.
The Convergence of Infrastructure and Atmosphere
The current crisis is not the result of a single failure but a synchronization of multiple stressors. Data from the Federal Aviation Administration (FAA) indicates that the disruption is being driven by a volatile mix of thunderstorms, high wind speeds, and aggressive traffic-management initiatives. While weather is a perennial factor in aviation, the severity of the current delays is being compounded by physical constraints on the ground—specifically runway construction projects that have reduced available capacity at critical gateways.
Boston Logan International serves as the epicenter of this instability. The airport is currently grappling with a ground delay averaging 124 minutes, a direct consequence of ongoing runway construction. When physical infrastructure is limited, the margin for error disappears; any weather-related slowdown immediately translates into massive queues of aircraft. This creates a "bottleneck effect" where delays at one hub ripple across the entire network, affecting flights that may not even be departing from the affected city but are waiting for an incoming aircraft to arrive.
Quantitative Breakdown of Hub Disruption
The scale of the disruption varies significantly by geography, with the Northeast corridor bearing the heaviest burden. The following data outlines the specific operational failures across the most impacted US airports:
| Airport | Delays | Cancellations | Origin Delay Rate | Destination Delay Rate |
|---|---|---|---|---|
| Boston Logan | 412 | 83 | 23% | 37% |
| New York JFK | 309 | 10 | 25% | 23% |
| New York LaGuardia | 250 | 8 | 25% | 21% |
| Miami | 189 | 1 | N/A | 15% |
| Los Angeles | 158 | 4 | N/A | 9% |
| Seattle-Tacoma | 142 | 3 | N/A | 11% |
| Orlando | 130 | 2 | N/A | 11% |
| Houston Bush | 127 | 5 | N/A | 12% |
| Harry Reid | 136 | 0 | N/A | N/A |
| Fort Lauderdale | 99 | 1 | N/A | N/A |
The disparity between origin and destination delay rates—particularly at Boston Logan, where destination delays hit 37%—suggests that the airport is struggling more with incoming traffic flow than outbound departures. This is a classic sign of "slot saturation," where the airport cannot clear arrivals fast enough to make room for departing aircraft.
Carrier Vulnerability and Network Stress
The disruption is not distributed evenly across airlines. The business models of different carriers influence how they absorb these shocks. Southwest and American Airlines are currently the most impacted, both recording over 600 delays.
Southwest, with 642 delays and 5 cancellations, is feeling the pressure of its high-frequency, point-to-point network. Because Southwest relies on rapid aircraft turns, a single delay in a hub like Boston or Miami can derail an entire day's schedule for a specific aircraft. American Airlines follows closely with 638 delays and 2 cancellations, reflecting its heavy reliance on the disrupted New York and Miami gateways.
Delta Air Lines and United have seen slightly lower, though still significant, disruption levels, with 455 and 304 delays respectively. However, the most alarming statistics come from regional operators. Republic Airways, despite its smaller scale, has suffered 187 delays and a staggering 22 cancellations. This suggests that regional feeders are being sacrificed to prioritize mainline wide-body flights, a common industry practice during capacity crunches. Alaska Airlines also reports a high cancellation-to-delay ratio, with 17 cancellations against 91 delays.
Expert Analysis: The Fragility of the Hub-and-Spoke Model
For travelers booking flights through these hubs, the direct consequence is a total erosion of the "scheduled" arrival time. The data reveals a systemic vulnerability: the US aviation network is operating at a capacity that leaves zero room for recovery. When the International Air Transport Association (IATA) discusses operational resilience, they refer to the ability of a system to return to normal after a shock. Currently, the US system is showing low resilience.
The pricing pressure created by these disruptions is indirect but potent. When airlines like Republic and Alaska face high cancellation rates, the sudden displacement of thousands of passengers creates an artificial spike in demand for the remaining available seats. This often leads to "dynamic pricing" surges on the last few remaining flights of the day, effectively penalizing the traveler for the airline's operational failure.
Furthermore, the 124-minute ground delay at Boston Logan is a warning sign regarding US airport infrastructure. When runway construction coincides with seasonal weather patterns, the result is not a minor inconvenience but a logistical collapse. Travelers should recognize that "construction" is now a primary risk factor, equal in weight to "weather." If a hub is undergoing significant runway work, the probability of a cascading delay increases by a factor of three during any weather event.
Key Takeaways
- Infrastructure Risk: Boston Logan is the most volatile hub currently, with a 37% destination delay rate and ground delays exceeding two hours due to runway construction.
- Carrier Impact: Southwest (642 delays) and American Airlines (638 delays) are the most disrupted carriers; Republic Airways has the highest volume of cancellations (22).
- Systemic Causes: The crisis is a "perfect storm" of thunderstorms, high winds, and reduced runway capacity, causing a ripple effect across the national airspace.
- Regional Fragility: Regional carriers are experiencing disproportionately higher cancellation rates, indicating a prioritization of mainline flights over feeder routes.
- Passenger Strategy: Travelers should prioritize checking airline-specific apps over airport monitors, as rebooking options vanish quickly during these spikes.
FAQ: US Flight Disruptions 2026
What should I do if my flight is cancelled at Boston Logan? Immediately use the airline's mobile app to rebook. Given the 124-minute ground delays and runway construction, avoid heading to the airport until you have a confirmed new departure time and a verified gate.
Why are regional airlines like Republic seeing more cancellations than major carriers? Airlines often cancel smaller regional "spoke" flights to free up crew and aircraft for larger "hub" flights that carry more passengers, minimizing the total number of displaced travelers.
How do thunderstorms in Miami affect flights in Los Angeles? The US aviation network is interconnected. If a plane scheduled to fly from Miami to LAX is delayed by storms, the LAX departure is delayed regardless of the weather in California.
Are my expenses covered if my flight is delayed by runway construction? Generally, construction is considered an operational issue, but airlines often categorize it as "uncontrollable." Keep all receipts for food and lodging and review your specific carrier's contract of carriage.
When the runway shrinks and the wind rises, the schedule becomes a suggestion, not a guarantee.
Tags: Boston Logan International, Federal Aviation Administration 2026, Southwest Airlines, American Airlines, US Airspace Disruptions 2026, Republic Airways
Related Travel Guides
- American, Southwest, and Major Airlines Add Special Flights Exceeding 50,000 Seats as Sports Travel Demand Swells
- UK Airport Disruption: Holafly Expert Shares Essential Advice for Travellers Facing Delays and Cancellations
- United Airlines Boosts US Travel Links With Japan and More in Major 2026 International Expansion: All You Need to Know
Disclaimer
This article is for informational and educational purposes only. It does not constitute legal, financial, or professional advice. While we strive to provide accurate and up-to-date information, travel policies, regulations, and conditions change rapidly. Always verify information with official sources before making travel decisions. Nomad Lawyer makes no representations about the accuracy, reliability, completeness, or suitability of the information provided. Readers should consult qualified professionals for advice specific to their circumstances. The views expressed in this article are those of the author and do not necessarily reflect the views of Nomad Lawyer.
Preeti Gunjan
Contributor & Community Manager
A passionate traveller and community builder. Preeti helps grow the Nomad Lawyer community, fostering engagement and bringing the reader experience to life.
Learn more about our team →