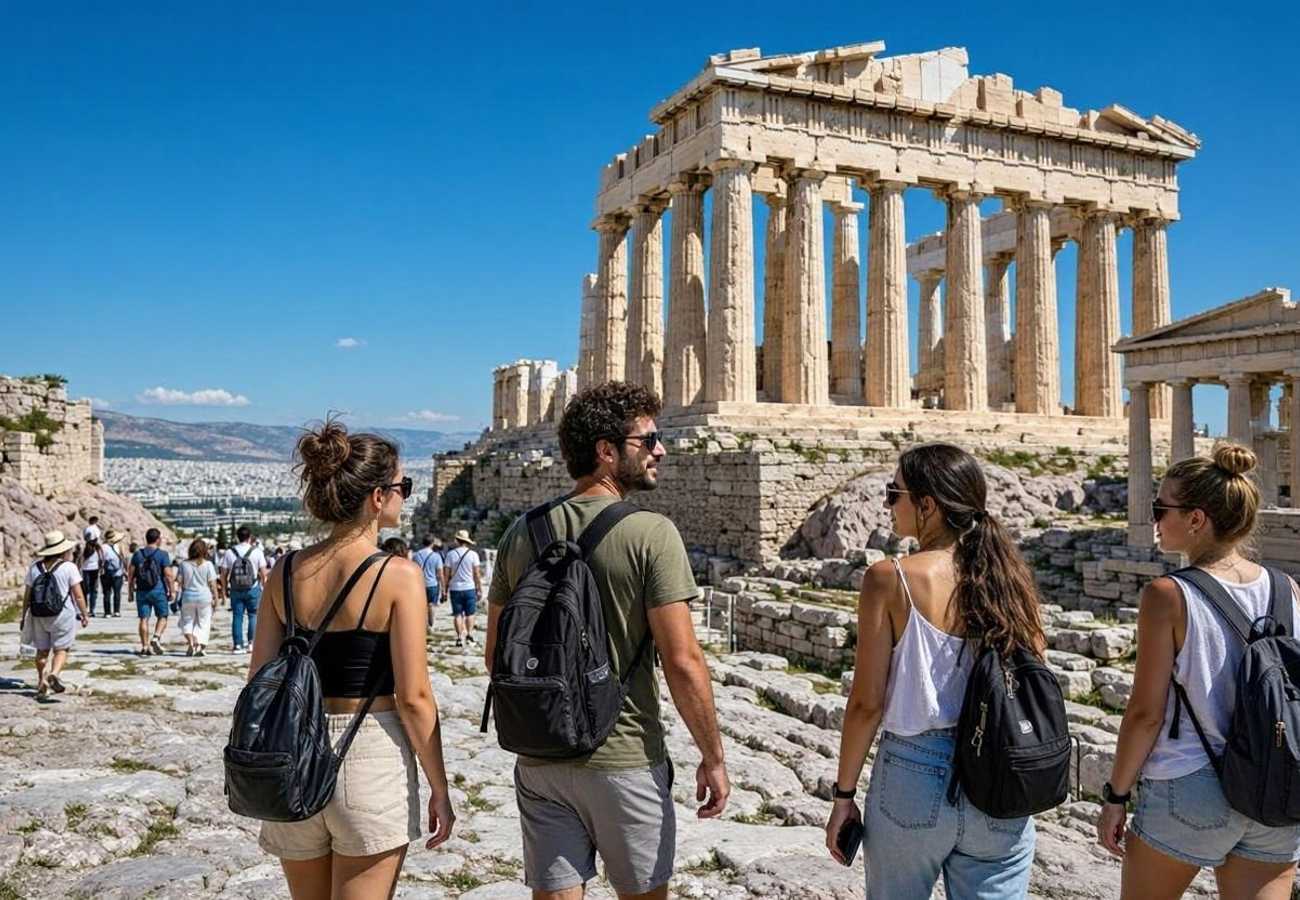
Europe and Saudi Arabia Reveal Two Competing Models for the Future of Sustainable Tourism

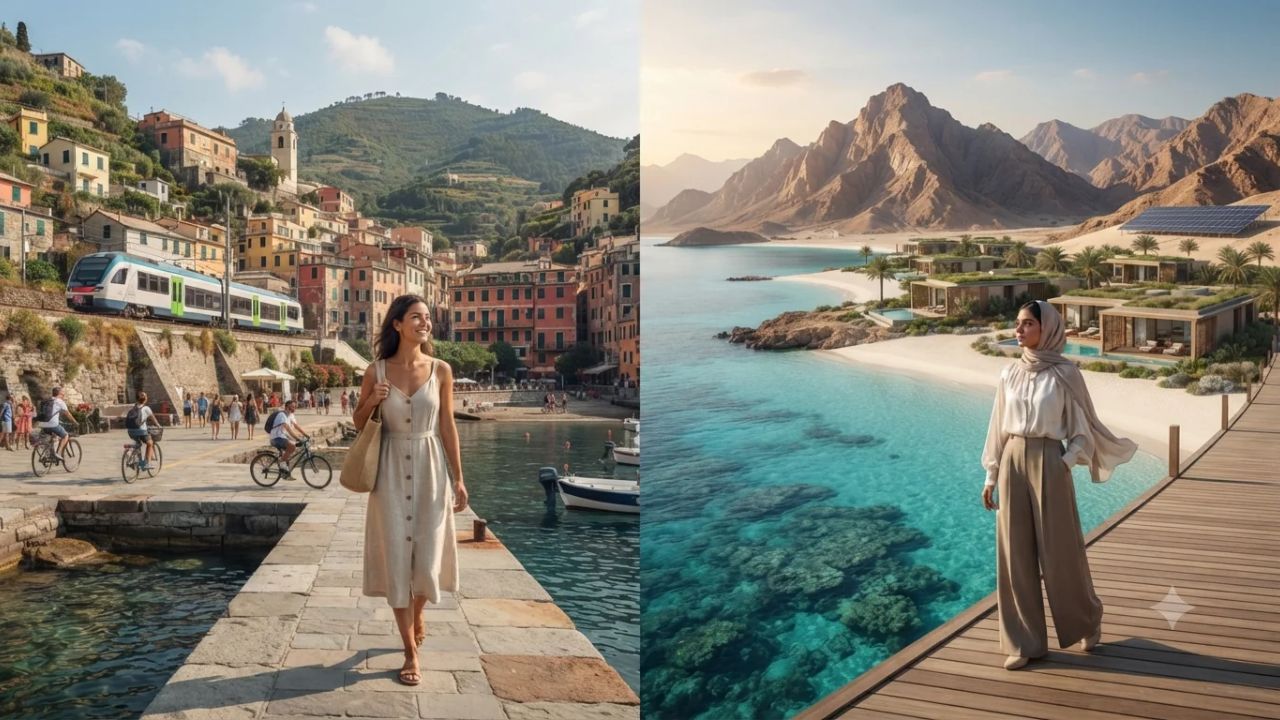
The international travel economy has reached an unprecedented crossroads in late 2026, punctuated by the simultaneous emergence of two sharply divergent doctrines for sustainable tourism development: the European Union’s regulatory strategy centered on de-densification, seasonal dispersion, and retrofitting mature visitor economies, contrasted against the Kingdom of Saudi Arabia’s US$120 billion sovereign-backed greenfield expansion designed to build high-efficiency tourism ecosystems from the ground up under Vision 2030. While Brussels unveiled its landmark EU Sustainable Tourism Strategy on November 4, 2026, to tame chronic overtourism across a continent that absorbed nearly 600 million international arrivals in 2025, Riyadh’s Ministry of Tourism and the Public Investment Fund (PIF) are deploying unprecedented capital to construct over 200,000 hotel keys and mega-destinations like The Red Sea and AMAALA under binding pledges of net-positive conservation. As both economic powers confront the twin imperatives of climate change and economic diversification, their parallel trajectories reveal a fundamental debate: whether authentic sustainability is best achieved by managing demand and constraining established destinations, or by engineering modern, state-controlled infrastructure built to pristine environmental specifications.
The scale of this policy contrast reflects the structural realities of their respective starting points. In the European Union, tourism functions as a mature, decentralized economic pillar generating 10.1% of the bloc's gross value added (GVA) and supporting more than 20 million jobs across five million enterprises—99% of which are small and medium-sized enterprises (SMEs). However, extreme geographical concentration has created intense friction: four Mediterranean and Central European nations (Spain, France, Germany, and Italy) capture more than 60% of all accommodation overnight stays, while 42% of all annual tourist nights remain compressed into just three peak summer months. In response, the European Commission’s ten-point roadmap emphasizes shifting from volume to value, enforcing stricter accommodation ecolabels by 2028, and deploying a pan-European Tourism Observatory by 2027 to monitor ecological carrying capacities. Conversely, Saudi Arabia is engineering a new leisure sector where none previously existed at commercial scale. Having logged 123 million domestic and inbound visits in 2025 and 61.2 million visits generating SAR 151.9 billion in spending during the first half of 2026 alone, the Kingdom is targeting 150 million annual visits by 2030, relying on off-grid solar-powered archipelago resorts, vast marine reserves covering 30% of its territorial waters, and centralized state ownership to enforce ecological compliance.
========================================================================================
SUSTAINABLE TOURISM DOCTRINES: EUROPEAN UNION VS. KINGDOM OF SAUDI ARABIA (2026)
========================================================================================
Strategic Metric         European Union Roadmap (EC Strategy)  Saudi Vision 2030 Tourism Pipeline
----------------------------------------------------------------------------------------
Primary Development Type Brownfield retrofitting & de-growth   Greenfield master-planned development
Total Capital Deployment Decentralized national/private spend  US$120+ Billion public/private pipeline
Sovereign Anchor Entity  European Commission & Member States   Public Investment Fund (PIF) / MoT
Annual Visitor Baseline  ~600 Million International (2025)     123 Million Total Visits (2025 Actual)
2030 Policy Target       Value-led dispersion & net-zero path  150 Million Combined Visits Target
Economic Weight (GDP)    10.1% Direct/Indirect EU GVA (2026)   Targeting 10% of National GDP by 2030
Enterprise Structure     5 Million enterprises (99% SMEs)      State giga-projects + 50+ global brands
Accommodation Pipeline   Retrofitting existing 28M+ bed-spaces 200,000+ new hotel room keys by 2030
Environmental Anchor     Natura 2000 network (27,000+ sites)   Saudi Red Sea Authority & RSG Net Gain
Conservation Commitment  €50B–€85B annual protected ecosystem  30% Net Conservation Gain by 2040;
                         economic yield; carrying capacity caps 30% Marine Protected Areas by 2030
Renewable Power Model    National grid decarbonization (REPowerEU) Dedicated 100% off-grid solar/battery
Water Supply Strategy    Municipal grid conservation & reuse   Large-scale desalination & brine management
Core Structural Hurdle   Overtourism, housing strain, SME cost High Scope 3 air emissions, hyper-aridity
========================================================================================
Sources: European Commission Directorate-General for Internal Market (DG GROW), Saudi Ministry of Tourism Special Report, PIF Strategy 2026–2030, and Red Sea Global Sustainability Framework.
========================================================================================
The European Paradigm: De-growth, Dispersion, and De-densification
The European Union's publication of its Sustainable Tourism Strategy on November 4, 2026, marks an institutional pivot away from the post-pandemic arrivals race that characterized regional policy between 2022 and 2025. By formally establishing three overarching strategic pillars divided across ten concrete action areas, the European Commission has signaled that aggregate visitor totals will no longer serve as the primary metric of tourism success. Instead, European tourism policy will prioritize economic yield retention, regional wealth equalization, and community ecological resilience.
Europe remains the undisputed titan of global tourism, recording close to 600 million international arrivals in 2025. However, this sheer volume has generated acute operational and social bottlenecks. European Commission data indicates that tourism is directly and indirectly responsible for 10.1% of European Union gross value added, anchoring regional economies across the Mediterranean basin and alpine corridors. Yet this economic contribution is severely distorted by spatial and temporal clustering.
========================================================================================
EUROPEAN TOURISM CONCENTRATION & SEASONALITY PROFILE (EUROPEAN COMMISSION 2026)
========================================================================================
Indicator Metric                     Observed Value       Policy Implication & Systemic Strain
----------------------------------------------------------------------------------------
Annual International Arrivals (2025) ~600 Million         World's highest continental tourist density
Share of Overnights in Top 4 States  >60.0% of Total      Severe concentration in Spain, France,
                                                          Germany, and Italy
Peak Season Compression Ratio        42.0% of Annual StaysConcentrated within 3 peak summer months
Tourism Contribution to EU GVA       10.1% Consolidated   Direct, indirect, and induced economic weight
Total Tourism Workforce              20+ Million Workers  Highly vulnerable to seasonal wage volatility
Enterprise Landscape                 ~5.0 Million Firms   99% classified as micro, small, or medium
Protected Natural Estate (Natura)    27,000+ Sites        Covers 18% of EU land and 10% of marine area
Annual Natura 2000 Economic Yield    €50B to €85B         Ecosystem service revenue supporting 2M jobs
========================================================================================
Source: European Commission Tourism Dashboard (Updated 18 November 2026) and Eurostat Regional Tourism Statistics.
========================================================================================
The Spatial Bottleneck: The Four-State Monopoly
More than six out of every ten tourist nights spent across the European Union occur in just four member states: Spain, France, Germany, and Italy. Within these nations, visitor traffic concentrates heavily into narrow urban and coastal corridors, including Catalonia, the Balearic and Canary Islands, the Île-de-France, the Veneto, and Tuscany.
This extreme geographic concentration has pushed urban centers past their social carrying capacity, triggering resident protests, street demonstrations, and municipal regulatory crackdowns. In Barcelona, municipal authorities have enacted ordinances to eliminate all 10,000 licensed short-term tourist apartments by 2028 to alleviate the city's housing affordability crisis. In Venice, the introduction of a pilot day-tripper access fee (Contributo di Accesso) was expanded in 2026 into a permanent tiered pricing model to penalize peak-hour day excursionists who generate waste and congestion without contributing to overnight hotel tax revenues.
The Temporal Trap: 42% Summer Saturation
Compounding the spatial imbalance is the temporal concentration of travel demand. European Commission figures show that destinations record an average of 42% of their total annual overnight stays within their three busiest summer months—typically June, July, and August. In coastal Greek archipelagos, Croatian islands, and southern Italian provinces, this figure exceeds 65%.
This seasonal volatility forces municipalities to construct water treatment plants, electrical substations, waste processing centers, and transit links capable of handling ten times their baseline resident population during peak season, only for that infrastructure to operate at a loss for eight months of the year. The EU Sustainable Tourism Strategy addresses this instability by prioritizing year-round cultural, wellness, culinary, and business travel, while discouraging marketing campaigns that promote conventional high-summer leisure getaways to saturated hotspots.
The 5 Million SME Challenge: Retrofitting Europe's Fragmented Hospitality Base
The primary institutional hurdle confronting Europe’s green transition lies in the fragmentation of its operating base. Unlike the corporate-led hospitality landscape of North America or the state-directed resort enclaves of the Arabian Gulf, Europe’s tourism sector comprises approximately five million businesses employing more than 20 million citizens. Significantly, 99% of these enterprises are small and medium-sized enterprises, with a vast majority operating as micro-businesses: family-owned pensions, independent boutique hotels, localized tour agencies, and independent restaurateurs.
========================================================================================
EUROPEAN UNION TOURISM TRANSITION TIMELINE (2026 – 2030 ACTION ROADMAP)
========================================================================================
Target Year  Strategic Milestone               Implementation Mechanism & Objectives
----------------------------------------------------------------------------------------
Late 2026    EU Sustainable Tourism Strategy   Commission adoption of 3 pillars and 10 action areas
2027         EU Tourism Observatory Launch     Deployment of real-time carrying capacity monitoring,
                                               data dashboards, and destination governance toolboxes
2027         SME Clean & Digital Support Hubs  Subsidized technical assistance, green energy audits,
                                               and digital management training for micro-enterprises
2028         Revised Accommodation Ecolabel    Introduction of stringent EU Ecolabel criteria covering
                                               lifecycle water use, energy ratings, and food waste
2029         Common European Tourism Data SpaceFederated cloud architecture enabling cross-border
                                               visitor flow tracking and predictive load management
2030         Net-Zero Horizon Interim Target   Binding 55% emissions reduction target across regional
                                               transport, municipal services, and hospitality stock
========================================================================================
Source: European Commission Directorate-General for Internal Market, Industry, Entrepreneurship and SMEs (DG GROW).
========================================================================================
The Capital Barrier in Heritage Properties
Europe’s hospitality architecture consists largely of historic stone masonry, century-old timber frames, and protected urban buildings subject to strict heritage preservation laws. Retrofitting these structures to achieve high-performance thermal insulation, installing heat pumps, replacing legacy plumbing with closed-loop greywater recycling systems, and deploying rooftop solar arrays requires substantial capital investment and complex municipal permitting.
A family-run 15-room guesthouse in the Dordogne or on a Cycladic hillside cannot access the sovereign credit facilities available to multinational developers. Without accessible European Union grants and low-interest loan guarantees, imposing aggressive decarbonization mandates risks forcing independent local owners to sell their properties to global corporate chains or real estate investment trusts, eroding the historic authenticity that attracted international travelers in the first place.
The Commission's strategy schedules focused clean and digital transition support starting in 2027, followed by updated tourist accommodation ecolabel criteria in 2028. These initiatives seek to create standardized, cost-effective environmental compliance pathways that small operators can realistically finance without compromising their solvency.
Natural Capital Economics: Natura 2000’s €85 Billion Engine
Europe’s primary environmental foundation is the Natura 2000 network, established under the 1992 Habitats Directive and the 1979 Birds Directive. Covering more than 27,000 protected sites across the 27 EU member states, Natura 2000 protects nearly 18% of the European Union's terrestrial landmass and more than 10% of its surrounding marine territory, forming the largest coordinated network of protected conservation areas on earth.
========================================================================================
NATURA 2000 PROTECTED NETWORK: ECONOMIC & ECOLOGICAL CONTRIBUTION
========================================================================================
Dimension Category           Verified Annual Metric  Socio-Economic & Conservation Function
----------------------------------------------------------------------------------------
Total Protected Sites        27,000+ Terrestrial & Marine Network spanning all 27 EU Member States
Terrestrial Area Coverage    ~18.0% of EU Land Territory Forested mountains, wetlands, grasslands, rivers
Marine Area Coverage         ~10.0% of EU Marine Waters  Coastal lagoons, reefs, and oceanic habitats
Direct Tourism Expenditure   €50B to €85B Annually       Revenues from hiking, wildlife tours, lodging
Full-Time Employment Yield   1.5M to 2.0M Direct FTEs    Sustainable rural employment and guiding services
Local Value Multiplier       €1.00 spent generates €2.40 High economic retention in peripheral communities
Management Challenge         Carrying capacity breaches  Trail erosion, wildlife disturbance, fire hazards
========================================================================================
Source: European Commission Directorate-General for Environment (DG ENV) Natura 2000 Economic Valuation Studies.
========================================================================================
The Ecotourism Valuation Paradox
According to official assessments highlighted by the European Commission in mid-2026, sustainable tourism and recreational activities linked directly to Natura 2000 sites generate between €50 billion and €85 billion annually in economic revenue, supporting between 1.5 million and 2.0 million full-time-equivalent jobs across the continent.
These figures prove that non-extractive, conserved natural capital can outperform traditional resource exploitation (such as commercial logging or intensive agriculture) in driving long-term rural prosperity. In regions such as the Bavarian Forest, the Picos de Europa in Spain, and the Danube Delta in Romania, ecotourism provides stable livelihood alternatives that deter rural depopulation.
However, success introduces an ecological paradox:
- Trail Degradation and Habitat Fragmentation: Unmanaged surges of hikers, mountain bikers, and campers create trail erosion and disturb ground-nesting raptors and vulnerable mammal species.
- Microclimate and Water Depletion: Remote alpine and Mediterranean nature reserves face severe water stress when boutique eco-lodges draw from delicate local aquifers during dry summer seasons.
- The Carrying Capacity Dilemma: European environmental managers must now implement mandatory digital reservation systems, trailhead access quotas, and vehicle bans across iconic parks—such as France's Calanques National Park near Marseille—to prevent ecological deterioration.
The Saudi Vision 2030 Paradigm: Greenfield Master-Planning and Giga-Project Capital
While Europe grapples with regulating established tourism flows across historic settlements, the Kingdom of Saudi Arabia is pursuing the most ambitious greenfield tourism engineering program in modern economic history. Governed by the national transformation blueprint of Vision 2030, the Kingdom’s tourism policy seeks to diversify the national economy away from hydrocarbon revenue, generate 1.6 million new domestic jobs, and establish Saudi Arabia as a top-five global destination.
In June 2026, the Saudi Ministry of Tourism released a comprehensive investment report revealing an active development pipeline exceeding US$120 billion in dedicated tourism capital. Backed by the financial power of the Public Investment Fund (PIF)—the Kingdom’s US$900+ billion sovereign wealth engine—the initiative aims to deliver more than 200,000 hotel room keys by 2030, with private institutional investors underwriting approximately 50% of total commercial development costs.
========================================================================================
SAUDI ARABIA TOURISM INVESTMENT & ARRIVALS BENCHMARKS (2025 – 2030 VISION)
========================================================================================
Performance Category         Reported Official Metric Commercial & Strategic Context
----------------------------------------------------------------------------------------
Total Capital Expenditure    US$120+ Billion Pipeline Capital allocated for resorts, ports, & transit
Target New Room Keys         200,000+ Keys by 2030    Doubling national branded accommodation supply
International Hotel Partners 50+ Global Hospitality BrandsMarriott, Hyatt, Accor, IHG, Rosewood, Aman
2025 Total Recorded Visits   123.0 Million Visits     Surpassed initial 100M target 7 years early
2025 Inbound Tourist Share   29.3 Million Inbound     High-spending regional and international arrivals
2030 National Visit Target   150.0 Million Visits     Revised upward after 2023 performance review
H1 2026 Combined Visits      61.2 Million Visits      Consistent pacing toward annual targets
H1 2026 Inbound Volume       12.5 Million Arrivals    Supported by new eVisa systems and air connectivity
H1 2026 Total Tourism Spend  SAR 151.9 Billion        US$40.5 Billion equivalent national expenditure
National Economic Target     10.0% of National GDP    Projected tourism contribution to non-oil GDP by 2030
========================================================================================
Source: Saudi Arabia Ministry of Tourism Official Special Investment Report (June 2026) and PIF Annual Disclosures.
========================================================================================
The Capital Discipline Shift: PIF's 2026–2030 Mandate
A notable evolution in the Saudi approach occurred in April 2026, when the Board of Directors of the Public Investment Fund formally approved its 2026–2030 Investment Strategy. The revised strategy moved beyond unchecked capital expenditure, establishing stringent requirements for:
- Investment Efficiency: Rigorous capital expenditure hurdle rates and project milestone verification.
- Private Capital Crowding-In: Ensuring international institutional investors, hospitality conglomerates, and local private developers co-fund at least 50% of commercial asset construction.
- Phased Capacity Delivery: Structuring resort openings in synchronized phases to align newly delivered accommodation keys with international airline seat capacity and proven traveler demand.
This discipline bridges an unexpected philosophical alignment between Riyadh and Brussels: both administrations now emphasize economic value and capital return over vanity arrival counts.
Segment Anatomy: Beyond Luxury Escapes
Media coverage of Saudi Arabia’s tourism transformation frequently focuses on ultra-luxury coastal enclaves and futuristic desert pavilions. However, an analysis of the Kingdom’s official half-year 2026 figures reveals a complex, multi-tiered visitor economy anchored by religious devotion and domestic movement.
========================================================================================
H1 2026 SAUDI INBOUND TOURISM COMPOSITION: PURPOSE OF VISIT BREAKDOWN
========================================================================================
Travel Purpose Category      Percentage Share Primary Destinations & Travel Motivators
----------------------------------------------------------------------------------------
Religious Pilgrimage         52.0% of Inbound Makkah, Madinah (Hajj, Umrah, year-round spiritual)
Leisure & Vacation           24.0% of Inbound Red Sea Coast, Riyadh, AlUla, Jeddah Historic, Asir
Business, Corporate & MICE   14.0% of Inbound Riyadh Exhibitions, Financial District, Giga-project B2B
Visiting Friends & Relatives 10.0% of Inbound Expatriate family networks and GCC cross-border travel
========================================================================================
Total Inbound Arrivals (H1 2026): 12.5 Million Overnight Visitors | Total Spend: SAR 151.9 Billion
Source: Kingdom of Saudi Arabia Ministry of Tourism Statistical Bulletin H1 2026.
========================================================================================
The Religious and Domestic Anchors
- The Religious Engine (52% of Inbound Volume): More than half of all international overnight visitors enter the Kingdom for religious pilgrimage to the holy cities of Makkah and Madinah. The expansion of high-speed rail links (the Haramain High-Speed Railway), streamlined Nusuk digital booking applications, and the liberalization of the Umrah visa have transformed pilgrimage tourism into an efficient, year-round economic driver.
- The Domestic Backbone (48.7 Million H1 Visits): Domestic travel accounted for four out of every five visits recorded in the first half of 2026. Saudi citizens and residents are spending vacations domestically rather than traveling abroad to Europe or Southeast Asia, drawn by mountain retreats in Asir, winter cultural festivals in Riyadh, and heritage tours in AlUla.
- The Leisure Sector (24% of Inbound Volume): While international leisure travel is expanding rapidly from a small historical baseline, it represents less than a quarter of inbound traffic. This distinction is critical: Saudi Arabia is not attempting to replace European cultural tourism, but rather capturing high-spending regional and niche global travelers seeking winter sun, pristine marine ecology, and uncrowded historical sites.
The Red Sea & AMAALA Laboratory: 100% Renewables and Net Conservation Gain
The flagship testing ground for Saudi Arabia’s sustainable greenfield model is The Red Sea and AMAALA, master-planned by state-owned developer Red Sea Global (RSG) across a pristine 28,000-square-kilometer archipelago and coastal corridor along the Kingdom's western coastline.
Unlike conventional Mediterranean or Caribbean resort corridors that expanded organically over decades without integrated utility planning, The Red Sea is engineered from inception to operate entirely off-grid, powered by dedicated solar energy installations backed by what is currently the world’s largest battery energy storage system (BESS), exceeding 1,200 megawatt-hours (MWh) of storage capacity.
========================================================================================
RED SEA GLOBAL (RSG) ECOLOGICAL MASTER-PLANNING METRICS
========================================================================================
Environmental Dimension      Engineering Commitment & Regulatory Framework
----------------------------------------------------------------------------------------
Geographical Scope           28,000 Square Kilometers across an archipelago of 90+ islands
Development Density Cap      Less than 1.0% of total land and marine area designated for construction
Renewable Energy Grid        100% Off-Grid Solar Photovoltaic arrays paired with 1,200+ MWh battery storage
Shura Island Flagship Anchor 430-room Grand Hyatt opening (November 2026); Foster + Partners design
Conservation Target (2040)   30% Net Conservation Gain across terrestrial and marine biodiversity
Protected Marine Management  5,015 sq km fisheries management sanctuary centered on Al Wajh Lagoon
Coral Reef Preservation      Dedicated coral nurseries propagating resilient thermotolerant species
Mangrove Restoration Target  Planting 50 Million mangrove trees across coastal intertidal zones by 2030
========================================================================================
Sources: Red Sea Global Sustainability Disclosures, Coral Bloom Architectural Blueprint, and PIF Press Statements.
========================================================================================
The Opening of the Grand Hyatt on Shura Island
In November 2026, the Public Investment Fund announced the official opening of the 430-room Grand Hyatt resort on Shura Island, the hub island of The Red Sea project designed by renowned architectural firm Foster + Partners under the "Coral Bloom" master plan.
The property illustrates the engineering scale of the Saudi sustainable model:
- Low-Impact Modular Construction: Over 70% of structural components were manufactured off-site in precision timber and lightweight materials to eliminate on-site concrete runoff into sensitive coral reef ecosystems.
- Dedicated Off-Grid Power: Operating entirely on solar electricity generated by inland solar farms, with zero direct connection to the national fossil-fuel-powered grid.
- Smart Building Automation: Integrated IoT environmental sensors regulate chilled water consumption, room cooling, and LED lighting based on real-time guest occupancy.
The 2040 Net Conservation Gain Target
In February 2026, Red Sea Global published its binding Net Conservation Gain Framework, committing the developer to achieve a 30% net increase in biodiversity value by 2040 compared to an undisturbed ecological baseline.
The strategy relies on:
- The Al Wajh Lagoon Sanctuary: Establishing a 5,015-square-kilometer managed fisheries area that bans commercial longline fishing, establishes no-anchor zones for superyachts, and protects apex predator populations (including hawksbill turtles, dugongs, and whale sharks).
- Mangrove Afforestation: Planting 50 million native mangrove seedlings by 2030 across tidal mudflats, creating blue carbon sinks capable of sequestering up to ten times more carbon per hectare than terrestrial tropical rainforests.
- Active Coral Restoration: Cultivating thermotolerant Red Sea coral taxa in specialized land-based and ocean-based nurseries to replenish damaged reefs and mitigate the impacts of regional marine heatwaves.
The Deep Structural Trade-Offs: Greenfield vs Brownfield, Water Intensity, and Desalination Brine
Evaluating these two models requires moving beyond promotional claims and examining their foundational environmental engineering compromises.
========================================================================================
STRUCTURAL TRADE-OFF MATRIX: EUROPEAN BROWNFIELD VS. SAUDI GREENFIELD
========================================================================================
Comparative Dimension    European Union (Brownfield Model)     Saudi Arabia (Greenfield Model)
----------------------------------------------------------------------------------------
Urban & Spatial Form     Dense historic urban centers; narrow  Low-density, master-planned coastal &
                         streets; shared public spaces         desert enclaves; strictly segregated access
Energy Integration       Grid-dependent; highly variable       Off-grid dedicated solar arrays; brand-new
                         decarbonization across 27 nations     high-efficiency central utility plants
Embodied Carbon Costs    Low incremental embodied carbon;     Extremely high initial embodied carbon
                         utilizes existing historic structures (transporting steel, glass, timber to remote desert)
Freshwater Generation    Relies on municipal surface/ground    100% dependent on sea water reverse osmosis;
                         aquifers; severe drought risk in Med  produces toxic hypersaline brine discharge
Ecosystem Impact         Chronic human encroachment, plastic   Localized construction disturbance; balanced
                         waste, sewage strain, trail erosion   by large-scale marine sanctuary enforcement
Governance & Enforcement Fragmented municipal councils; local  Centralized sovereign command; unified
                         resident protests; litigation delays  environmental standards; single master developer
========================================================================================
The Water Scarcity Challenge: Desalination and Marine Ecology
Water availability represents the most critical environmental vulnerability in the Middle East. While southern Europe faces seasonal water deficits that pit resort golf courses and hotel swimming pools against agricultural irrigation, Saudi Arabia operates in a hyper-arid climate with zero permanent natural rivers.
To supply its giga-projects, the Kingdom relies entirely on Seawater Reverse Osmosis (SWRO) desalination. While modern plants operated by Red Sea Global are powered by solar electricity—eliminating operational Scope 2 emissions—the fundamental physical byproduct of reverse osmosis is hypersaline brine.
For every liter of fresh potable water extracted from the sea, approximately 1.5 liters of concentrated brine—frequently laced with anti-scalant chemicals and thermal residues—must be managed:
- Benthic Suffocation Risks: If discharged carelessly into shallow coastal waters, dense hypersaline brine sinks to the ocean floor, depleting dissolved oxygen and killing delicate coral polyps, seagrass meadows, and benthic marine organisms.
- Advanced Brine Diffusion: Red Sea Global has addressed this challenge by engineering deep-water discharge outfalls equipped with high-velocity multi-port diffusers located in areas with strong tidal flushing. In addition, research initiatives in 2026 are exploring mineral extraction technologies to mine commercial-grade salts, magnesium, and lithium from brine before discharge.
- Destination Carrying Capacity: True water sustainability cannot be claimed by merely reporting low per-capita tap flow rates; it requires public accounting of the total volume of seawater extracted, energy expended per cubic meter, and long-term marine biological monitoring around discharge zones.
The Aviation Reality: Scope 3 Emissions and Full-Journey Accounting
The most significant blind spot in both European and Saudi sustainable tourism narratives is the issue of Scope 3 aviation emissions. Tourism marketing frequently celebrates zero-emission hotels and solar-powered golf carts while ignoring the carbon cost of long-haul international flights.
========================================================================================
FULL-JOURNEY TOURISM EMISSIONS SPECTRUM (SCOPE 1, 2, AND 3 EMISSIONS)
========================================================================================
Emissions Category       Operational Activity Involved        Dominant Policy Mitigation Path
----------------------------------------------------------------------------------------
Scope 1 (Direct Site)    Hotel boilers, kitchen gas, resort   100% electrification, induction cooking,
                         patrol vehicles, on-site generators  electric buggies, ban on fossil heating
Scope 2 (Indirect Power) Purchased electricity from regional  Dedicated off-grid solar arrays (Saudi);
                         or national power utility grids      REPowerEU green grid purchasing (Europe)
Scope 3 (Supply Chain)   Food sourcing, hotel linen laundering,Local organic procurement mandates;
                         construction material embodied carbonmodular timber; closed-loop waste systems
Scope 3 (Visitor Transit)International commercial aviation,   High-Speed Rail expansion (Europe);
                         regional flights, cruise arrivals    Sustainable Aviation Fuel (SAF) blending mandates
========================================================================================
Source: Greenhouse Gas Protocol Corporate Value Chain (Scope 3) Accounting and Reporting Standard.
========================================================================================
The Flight Paradox
According to data from the United Nations World Tourism Organization (UNWTO) and the International Air Transport Association (IATA), transportation accounts for between 75% and 85% of all greenhouse gas emissions generated by international tourism, with passenger aviation representing the overwhelming majority.
- The Saudi Long-Haul Vulnerability: To achieve its high-spending international leisure targets, Saudi Arabia must attract visitors from Western Europe, North America, and East Asia. A British traveler flying from London Heathrow to the newly opened Red Sea International Airport (RSI) generates roughly 1.6 to 2.2 metric tonnes of carbon dioxide equivalent round-trip. Even if the traveler stays at a 100% solar-powered resort like the Grand Hyatt Shura Island, more than 90% of the trip's lifetime carbon footprint is burned in the stratosphere before check-in.
- Europe’s Rail Advantage vs. Aviation Reality: Europe possesses the world’s most extensive cross-border high-speed passenger rail network, allowing travelers to reach destinations across France, Germany, Spain, and Italy with up to 90% fewer emissions than flying. However, low-cost carriers (such as Ryanair, easyJet, and Wizz Air) continue to operate tens of thousands of point-to-point seasonal flights connecting northern European capitals with Mediterranean beach resorts, making cheap flying faster and more economical than international rail journeys.
- The SAF Mandate: Both regions recognize this challenge. Under the European Union’s ReFuelEU Aviation initiative, aviation fuel suppliers must ensure that aviation fuel made available at EU airports contains at least 2% Sustainable Aviation Fuel (SAF) in 2025, rising to 6% by 2030 and 70% by 2050. Similarly, Saudi Arabia is investing billions through state oil company Aramco to develop commercial-scale synthetic e-fuels and green hydrogen-derived aviation propellants to future-proof its tourism ambitions.
Community Equity and Economic Leakage: Resident Housing Displacement vs State Employment Mandates
Sustainable tourism cannot be defined by environmental metrics alone; it must ensure economic fairness and quality of life for host communities. In this social dimension, the European and Saudi models exhibit contrasting socio-economic structures.
========================================================================================
HOST COMMUNITY SOCIO-ECONOMIC COMPARISON: RESIDENT WELFARE & EMPLOYMENT
========================================================================================
Socio-Economic Vector    European Union Mature Market          Saudi Arabian Emerging Market
----------------------------------------------------------------------------------------
Primary Social Tension   Housing crisis; rent inflation;       Balancing social transformation; rapid
                         overcrowding of municipal amenities   integration of youth & female workforce
Housing Displacement     Severe: conversion of residential     Minimal: giga-projects built largely on
                         apartments into short-term rentals    uninhabited desert & coastal islands
Workforce NationalizationNaturally high local employment, but  Saudization quotas: mandatory hiring of
                         strained by seasonal low-wage labor   citizens in management & operational roles
Economic Leakage Risk    Low in diversified economies, but     Historically high in luxury hospitality;
                         high in tour-operator-dominated ports currently mitigated by localized supply chains
Community Governance     Democratic municipal councils; public Sovereign-led planning; centralized
                         hearings; grass-roots activist groups consultation with regional tribal communities
========================================================================================
Europe’s Overtourism and Housing Crisis
In southern Europe, the primary negative externality of tourism is the conversion of residential housing stock into unregulated short-term holiday rentals via online platforms. In cities like Lisbon, Athens, Florence, and Palma de Mallorca, long-term rental prices have skyrocketed relative to average wages, pricing nurses, teachers, police officers, and service workers out of historical city centers.
This dynamic has created deep social resentment, transforming tourism from an engine of post-war civic pride into a catalyst for urban gentrification. The EU Sustainable Tourism Strategy directly addresses this fracture by urging member states to enforce mandatory host registration systems, share rental data across borders, and empower municipalities to cap tourist bed capacities in saturated neighborhoods.
Saudi Arabia’s Nationalization and Regional Empowerment
In Saudi Arabia, the social dynamic is inverted. Because giga-projects like The Red Sea, AMAALA, and NEOM are constructed along largely unpopulated coastlines and desert plains, they do not displace established urban residential neighborhoods or inflate urban rents.
Instead, the primary socio-economic objective is human capital development:
- Saudization (Nitaqat) Mandates: Hospitality operators must comply with strict nationalization quotas, ensuring Saudi men and women hold frontline, supervisory, and executive hospitality roles.
- Vocational Training Institutes: Red Sea Global and the Ministry of Tourism have established dedicated vocational training academies offering scholarships to young Saudis from local rural communities (such as Umluj and Al Wajh), training them in hotel management, marine biology, eco-guiding, and executive culinary arts.
- Local Supplier Sourcing: Developing micro-economies around remote resorts by contracting local agricultural farms, artisanal fishermen, and heritage craft cooperatives to supply five-star hotel kitchens and gift boutiques.
Future Roadmap Matrix: Policy Timelines and Milestones (2026 to 2040)
To track the progress of these competing strategies over the next fifteen years, policymakers, investors, and travel professionals must monitor a series of scheduled legislative and operational benchmarks.
========================================================================================
MASTER IMPLEMENTATION TIMELINE: EUROPEAN UNION & SAUDI ARABIA (2026 – 2040)
========================================================================================
Year   European Union Milestones                Kingdom of Saudi Arabia Milestones
----------------------------------------------------------------------------------------
2026   Adoption of EU Sustainable Tourism       Completion of H1 61.2M visits; opening of
       Strategy (3 pillars, 10 action areas)    Grand Hyatt Shura Island (430 rooms)
2027   Full deployment of EU Tourism            Delivery of initial Red Sea phase; deployment
       Observatory for visitor carrying capacityof PIF 2026–2030 private capital framework
2028   Introduction of revised, binding         Targeting 100,000 newly delivered branded room
       EU Tourist Accommodation Ecolabel rules  keys across Riyadh, Red Sea, and Jeddah
2029   Implementation of Common European        Opening of primary AMAALA wellness resort
       Tourism Data Space for digital tracking  facilities and marine biology research center
2030   EU Climate Target: 55% net emissions     Vision 2030 Target: 150 Million annual visits;
       reduction; ReFuelEU 6% SAF mandate       30% Marine Protected Areas under SRSA
2035   Review of Natura 2000 carrying capacity  Targeting 10% non-oil GDP contribution; full
       benchmarks; 20% SAF blending mandate     maturation of domestic leisure connectivity
2040   EU Climate Neutrality transitional check;Red Sea Global Target: 30% Net Conservation
       broad-scale intercity rail integration   Gain across all marine and coastal habitats
========================================================================================
Sources: European Commission Work Programme 2026–2030, Saudi Vision 2030 Strategic Delivery Unit, and Red Sea Global.
========================================================================================
Frequently Asked Questions
What are the main differences between European and Saudi sustainable tourism strategies?
Europe focuses on a brownfield regulatory model aimed at managing overtourism, capping visitor density, spreading arrivals into rural areas and off-peak seasons, and retrofitting existing small businesses. Saudi Arabia operates a greenfield investment model, deploying more than US$120 billion to build brand-new, off-grid, eco-engineered resorts that incorporate solar power and marine conservation from inception.
When was the EU Sustainable Tourism Strategy officially unveiled?
The European Commission officially unveiled the EU Sustainable Tourism Strategy on November 4, 2026, structuring its policy around three core pillars and ten action areas.
How many international tourists visited Europe in 2025?
Europe welcomed close to 600 million international tourists in 2025, according to official data published by the European Commission.
Which four countries account for the majority of European tourism overnight stays?
Spain, France, Germany, and Italy together account for more than 60% of all tourist accommodation overnight stays across the European Union.
What is the seasonal concentration of tourism in the European Union?
An average of 42% of all tourist nights in the European Union are concentrated within each destination's three busiest months, creating extreme infrastructure strain during peak summer periods.
What are Saudi Arabia’s official visitor targets under Vision 2030?
Saudi Arabia aims to achieve 150 million domestic and international tourist visits annually by 2030. In 2025, the Kingdom recorded 123 million total visits, including 29.3 million inbound tourists.
What did Saudi Arabia achieve in tourism during the first half of 2026?
In the first half of 2026, Saudi Arabia recorded 61.2 million combined domestic and inbound visits, generating approximately SAR 151.9 billion in total tourism expenditure, with inbound arrivals reaching 12.5 million.
What percentage of inbound travel to Saudi Arabia is for religious pilgrimage?
In the first half of 2026, religious pilgrimage (Hajj and Umrah) accounted for 52% of all international overnight visitors, while leisure travel represented 24%.
What is Red Sea Global’s 2040 conservation target?
Red Sea Global is legally committed to achieving a 30% net conservation gain across terrestrial and marine biodiversity throughout The Red Sea and AMAALA destinations by 2040.
How does the Natura 2000 network contribute to European tourism?
Covering more than 27,000 protected sites across nearly one-fifth of EU land, the Natura 2000 network generates between €50 billion and €85 billion annually in nature-based tourism spending and supports up to two million full-time jobs.
Strategic Outlook: The Geopolitical and Environmental Convergence of Sustainable Tourism
As Europe and Saudi Arabia advance their respective tourism agendas toward 2030, the global travel industry is witnessing a profound redefinition of how destinations balance economic growth with environmental responsibility. Neither model offers a flawless template, yet each provides essential lessons for the future of global leisure.
Europe demonstrates that unchecked volume without strict carrying-capacity enforcement inevitably erodes civic goodwill, strains public municipal infrastructure, and degrades historic cultural assets. Its future success will depend on whether Brussels and national governments can provide small and medium-sized operators with the capital and technology required to decarbonize aging buildings without extinguishing local character.
Saudi Arabia demonstrates that massive sovereign capital, centralized planning, and modern clean engineering can establish luxury tourism destinations that bypass the fossil-fuel legacy infrastructure of older markets. However, the Kingdom’s ultimate credibility will hinge on transparent, third-party scientific verification: proving that high-volume visitor arrivals can coexist with fragile desert hydrology, that hypersaline desalination brine does not suffocate coral ecosystems, and that the carbon footprint of long-haul passenger flights can be mitigated by sustainable fuels.
Ultimately, sustainable tourism cannot be validated by policy declarations, hotel ribbon-cuttings, or marketing campaigns. The true benchmark of success will be measured over decades: in preserved marine biodiversity, restored coastal wetlands, stabilized resident housing markets, and resilient local economies that enrich both travelers and host communities for generations to come.
Related Travel Guides
- Azamara, MSC, Princess, and Oceania Launch Black Friday 2026 Cruise Deals with Up to 50% Off and $1,000 Credits
- European Airports Post 3.2% Passenger Growth as Madrid Overtakes Paris and Winter Seat Capacity Slows to 1.6%
- Spain Records 9.6 Million International Tourists in September as Morocco Arrivals Drop 20.6%
- Brazil Welcomes Over 6.1 Million International Tourists with Historic Surge in Chinese Travelers
This article is for informational purposes. Flight routes, passenger regulations, visa rules, and transit advisories are subject to change by airlines and aviation authorities. Readers are advised to verify schedules and travel documentation with relevant carriers and border agencies before departure.
Related Stories

Bohol Secures UNESCO Green Card Anew: Philippines’ Only Global Geopark Reaffirms Sustainable Tourism Leadership
Saudi Arabia, UAE, Qatar, and Egypt Defy Tourism Crisis Claims: Official UN Tourism and Ministry Data Reveal Resilient Travel Growth in 2026