US Air Travel Gripped by Delays: Dallas, Chicago, and SFO Hit by 2,956 Disruptions

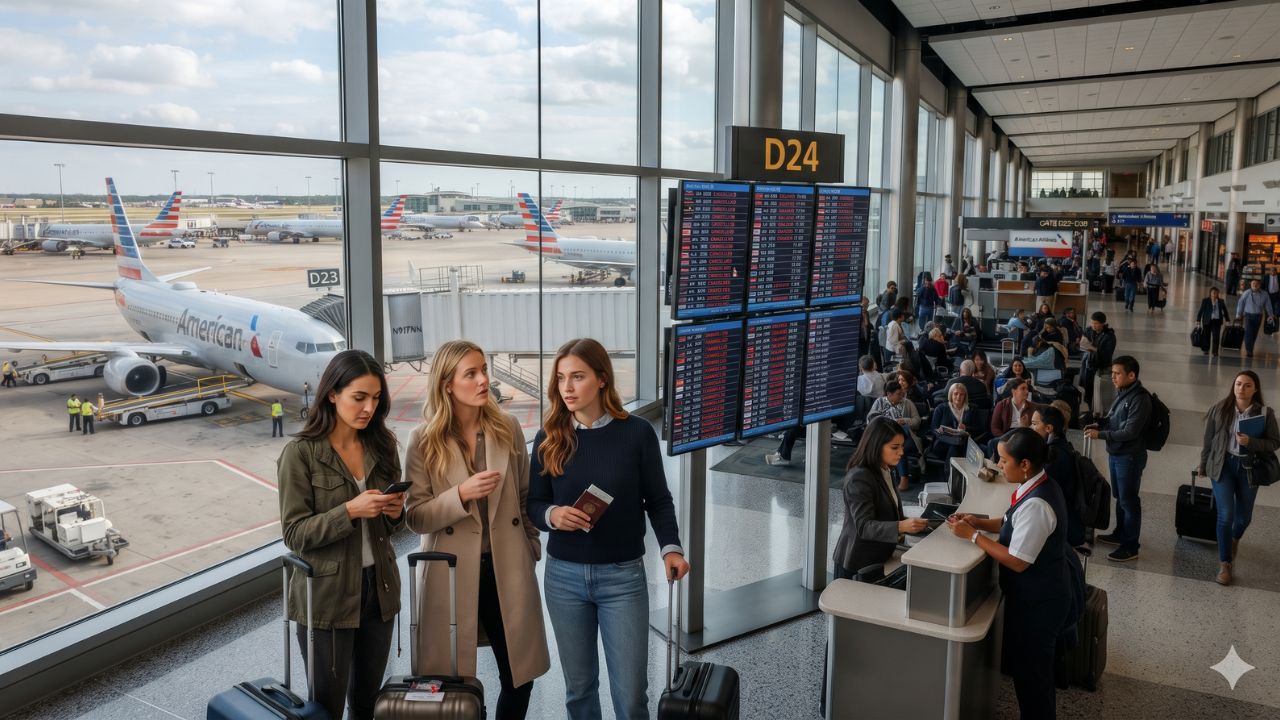
Long after a federal computer glitch is resolved, the mathematical knot of out-of-position flight attendants, pilots exceeding duty-time limits, and misplaced aircraft can paralyze an entire national airspace for days. On 16 and 17 November 2026, air carriers across the United States reported a staggering 2,956 flight delays and 330 cancellations affecting domestic, inbound, and outbound journeys. The systemic unraveling stems directly from the aftermath of a major Federal Aviation Administration (FAA) telecommunications system failure on November 13 that forced an emergency nationwide ground stop, creating an operational backlog that local weather restrictions in California and Texas continue to magnify.
Ground Stops and Telecom Failures: Inside the Systemic US Flight Backlog
The November 13 telecom outage halted departure gates across the country, preventing flight plan transmissions and grounding aircraft at their departure points. While technical technicians restored signal feeds within hours, restoring airline crew and airframe rotations has proven far more complex. Modern airlines operate tightly integrated hub-and-spoke schedules where a Boeing 737 or Airbus A321 touches down in five cities across a single working day; when early flights miss their departure slots, aircraft and flight crews end up stranded hundreds of miles away from their scheduled afternoon routes.
Compounding these structural recovery pains, localized autumn weather patterns added immediate operational friction. San Francisco International Airport (SFO) suffered strict arrival limits due to low marine cloud ceilings, forcing controllers to space landing traffic onto single runways, while San Diego International Airport (SAN) experienced heavy volume-related arrival pacing. The compound effect hit American Airlines and its primary fortress hub at Dallas-Fort Worth International Airport (DFW) hardest, where 428 delays and 67 cancellations accumulated, marking the highest disruption count of any single airport in the nation.
Airport Disruption Statistics Across the United States (17 November 2026)
The schedule below details verified flight cancellations and delays compiled from real-time monitoring records recorded on 16 November at 1:28 pm ET:
| Airport Facility & Code | State Location | Total Flights Delayed | Total Flights Canceled | Primary Operational Friction |
|---|---|---|---|---|
| Dallas-Fort Worth (DFW) | Texas | 428 | 67 | Hub rotation collapse & crew displacement |
| Chicago O’Hare (ORD) | Illinois | 225 | 50 | Midwest transit pacing & connecting holds |
| San Francisco (SFO) | California | 182 | 15 | Low cloud ceiling arrival spacing |
| Charlotte Douglas (CLT) | North Carolina | 179 | 34 | Southeast connection bank compression |
| Phoenix Sky Harbor (PHX) | Arizona | 160 | 27 | Western desert arrival vectoring |
| Miami International (MIA) | Florida | 153 | 21 | Latin American gateway rotation delays |
| Los Angeles International (LAX) | California | 134 | 29 | Transpacific & transcontinental sequencing |
| Orlando International (MCO) | Florida | 132 | 16 | Leisure passenger terminal holds |
| Denver International (DEN) | Colorado | 118 | 12 | Mountain hub arrival vectoring |
| Reagan Washington (DCA) | District of Columbia | 109 | 16 | Slot-restricted runway volume holds |
| New York LaGuardia (LGA) | New York | 104 | 6 | Perimeter-rule runway capacity limits |
| New York JFK (JFK) | New York | 98 | 16 | International arrival bank sequencing |
| Fort Lauderdale (FLL) | Florida | 96 | 11 | Florida peninsula airspace pacing |
| Philadelphia (PHL) | Pennsylvania | 94 | 13 | Northeast airway vector holds |
| Boston Logan (BOS) | Massachusetts | 93 | 13 | Coastal wind and volume holds |
| Las Vegas Harry Reid (LAS) | Nevada | 93 | 4 | West Coast airspace compression |
| San Diego International (SAN) | California | 89 | 10 | Volume-related approach pacing |
| Austin-Bergstrom (AUS) | Texas | 84 | 5 | Regional feeder rotation holds |
| Nashville International (BNA) | Tennessee | 82 | 3 | Mid-South transit delays |
| Seattle-Tacoma (SEA) | Washington | 80 | 5 | Pacific Northwest airway adjustments |
| Houston George Bush (IAH) | Texas | 78 | 10 | Gulf coast network rotation delays |
| Minneapolis–Saint Paul (MSP) | Minnesota | 66 | 3 | Northern hub schedule delays |
| Newark Liberty (EWR) | New Jersey | 55 | 12 | Airspace slot compression |
| St. Louis Lambert (STL) | Missouri | 52 | 5 | Midwest connecting delays |
| San Juan Luis Muñoz Marín (SJU) | Puerto Rico | 50 | 6 | Caribbean island feeder delays |
| Detroit Metropolitan (DTW) | Michigan | 46 | 9 | Great Lakes feeder rotation holds |
| Baltimore/Washington (BWI) | Maryland | 42 | 3 | Mid-Atlantic network delays |
| Kansas City (MCI) | Missouri | 38 | 2 | Midwest feeder connections |
| Raleigh-Durham (RDU) | North Carolina | 37 | 7 | Regional connection delays |
| Southwest Florida (RSW) | Florida | 33 | 5 | Seasonal tourist arrival holds |
| Cincinnati (CVG) / Houston Hobby (HOU) | Ohio / Texas | 31 each | 2 (CVG) / 3 (HOU) | Regional network pacing |
| Columbus (CMH) | Ohio | 27 | 4 | Feeder aircraft turnaround holds |
| New Orleans (MSY) | Louisiana | 25 | 8 | Gulf feeder schedule cancellations |
| Palm Beach (PBI) | Florida | 23 | 6 | South Florida terminal volume holds |
| Westchester County (HPN) | New York | 16 | 3 | Regional executive runway holds |
| San Antonio (SAT) / Tucson (TUS) | Texas / Arizona | 13 each | 6 (SAT) / 3 (TUS) | Southwest regional holds |
| South Bend (SBN) | Indiana | 12 | 3 | Feeder connection cancellations |
| Omaha (OMA) / Honolulu (HNL) | Nebraska / Hawaii | 11 each | 5 (OMA) / 3 (HNL) | Outstation schedule adjustments |
| Des Moines (DSM) | Iowa | 10 | 4 | Regional feeder cancellations |
| Nantucket Memorial (ACK) | Massachusetts | 0 | 8 | Island feeder route cancellations |
Among airlines, American Airlines bore the brunt of the breakdown, logging 165 cancellations (4% of operations) and 756 delays (22%), driven by its concentration in Dallas and Charlotte. Regional carrier SkyWest absorbed 65 cancellations (2%) and 300 delays (11%), while JetBlue recorded 30 cancellations (3%) and 109 delays (11%), and United logged 20 cancellations and 170 delays. Southwest Airlines accumulated 438 delays (11%) alongside 11 cancellations, while Delta posted 283 delays (8%) and 11 cancellations. Regional operators like PSA Airlines saw a 22% delay rate across 173 flights, while Endeavor Air logged 101 delays (12%).
What Makes Central Megahub Disruptions Geographically Unique
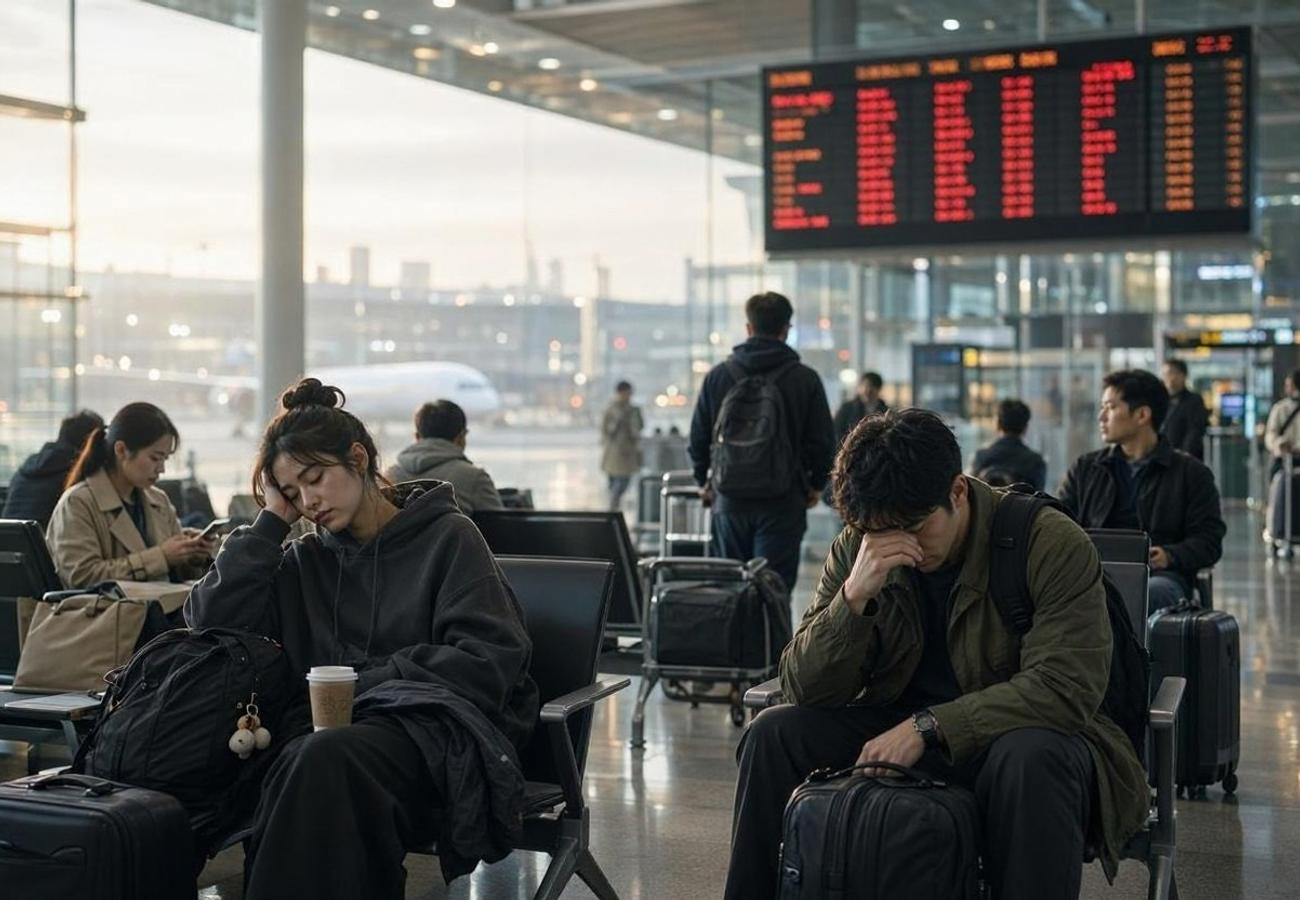
The geography of American aviation depends on central transfer hubs to route travelers between eastern and western shores. Airports like Dallas-Fort Worth and Chicago O'Hare are designed as massive interchange points where dozens of planes land simultaneously in coordinated banks to exchange passengers. When an external shock—like the FAA telecommunications breakdown—delays incoming feeder planes from secondary cities like Omaha, Des Moines, or Columbus, hundreds of passengers miss onward connections, turning terminals into overnight dormitories.
DFW's vast airfield spans over 17,000 acres across five separate terminal buildings. When severe gate holds occur, planes wait on taxiways for open gates while arriving travelers face immense walks between terminals. Telemetry from the Federal Aviation Administration National Airspace System demonstrates how local bottlenecks in northern Texas or Illinois ripple westward into Phoenix and Los Angeles, creating delays across states that experienced perfectly sunny weather.
Visitor Insider Tips: Navigating DFW, Chicago O'Hare, and Rebooking Hacks
Experienced travelers moving through affected hubs during recovery windows should use these tactical steps to protect their itineraries:
- Master the DFW Skylink People Mover: If your connecting flight at DFW is moved to another terminal due to gate reassignments, do not exit security. Take the automated Skylink train, which runs airside on an elevated loop every two minutes, linking all five terminals (A, B, C, D, and E) with maximum transit times under nine minutes.
- Understand the 7-Day DOT Refund Rule: Under statutory consumer protections enforced by the US Department of Transportation, if an airline cancels your flight or makes a significant schedule revision and you choose not to travel, the airline must issue a complete cash refund to your original payment method within seven business days for credit card transactions. You are not obligated to accept electronic travel vouchers.
- Skip Customer Service Lines with In-App Chat: When lines at airport customer assistance counters stretch hundreds of travelers deep, open your airline's smartphone app. Use the digital messaging feature or phone the carrier's international toll-free assistance lines (such as UK or Australian call centers) to secure immediate rebooking before domestic queues clear.
- Consider Overland Rail for Midwest Corridors: If your regional flight out of Chicago O'Hare to Milwaukee, Detroit, or St. Louis is canceled, take the Blue Line CTA train directly into Chicago Union Station and transfer onto Amtrak regional rail services, avoiding multi-day airport standby lists.
Cultural and Environmental Context: Grid Reliability and Consumer Rights
The vulnerability of modern air travel to central digital network failures has sparked debate regarding critical transport infrastructure. As the Official US Tourism Portal works to welcome millions of overseas visitors exploring natural monuments cataloged by UNESCO World Heritage, maintaining resilient ground and air networks is essential for sustainable economic mobility.
Environmental impacts also escalate during ground delay programs. When hundreds of aircraft idle engines on taxiways awaiting gate clearance, fuel burn and localized emissions spike dramatically. Airport authorities at DFW and O'Hare are implementing advanced gate electrification and ground metering technologies, keeping aircraft parked at gates with main engines off until departure windows are verified. For travelers, understanding passenger rights and planning generous connection windows ensures that national aviation disruptions remain manageable pauses rather than travel emergencies.
FAQ: Navigating US Airline Disruptions November 2026
What caused the widespread flight disruptions across US airports on 16–17 November 2026? Disruptions were triggered by the cascading aftermath of a major FAA telecommunications failure on November 13, which displaced aircraft and flight crews, compounded by low cloud ceilings at SFO and traffic pacing in San Diego.
Which airport and airline suffered the highest number of cancellations and delays? Dallas-Fort Worth International Airport (DFW) led airports with 428 delays and 67 cancellations, while American Airlines led carriers with 756 delays and 165 cancellations.
Am I entitled to a cash refund if my flight is canceled due to an FAA ground stop? Yes, under US Department of Transportation regulations, passengers who choose not to accept an alternative flight following a cancellation or major delay are entitled to a full cash refund within seven business days.
How can I quickly transfer between terminals during a tight connection at DFW? Use the airside DFW Skylink automated train, which operates 24/7 inside the security perimeter, connecting Terminals A, B, C, D, and E in under nine minutes.
Patience, verified mobile tracking, and an understanding of federal refund rules turn unexpected runway delays into manageable detours across the American heartland.
This article is for informational purposes. Flight routes, passenger regulations, visa rules, and transit advisories are subject to change by airlines and aviation authorities. Readers are advised to verify schedules and travel documentation with relevant carriers and border agencies before departure.
Related Stories
US Aviation Chaos 2026: Dallas and Chicago Lead 2,956 Flight Delays After FAA Telecom Failure
Asia Aviation Crisis 2026: 4,461 Delays and 365 Cancellations Hit Dubai, Delhi, and Mumbai