
Georgia Tops The List Followed By Texas and More With the Strongest Air Travel Markets as US Reach $9.8 Billion Air Ticket Sales
Georgia Tops The List Followed By Texas and More With the Strongest Air Travel Markets as US Reach $9.8 Billion Air Ticket Sales

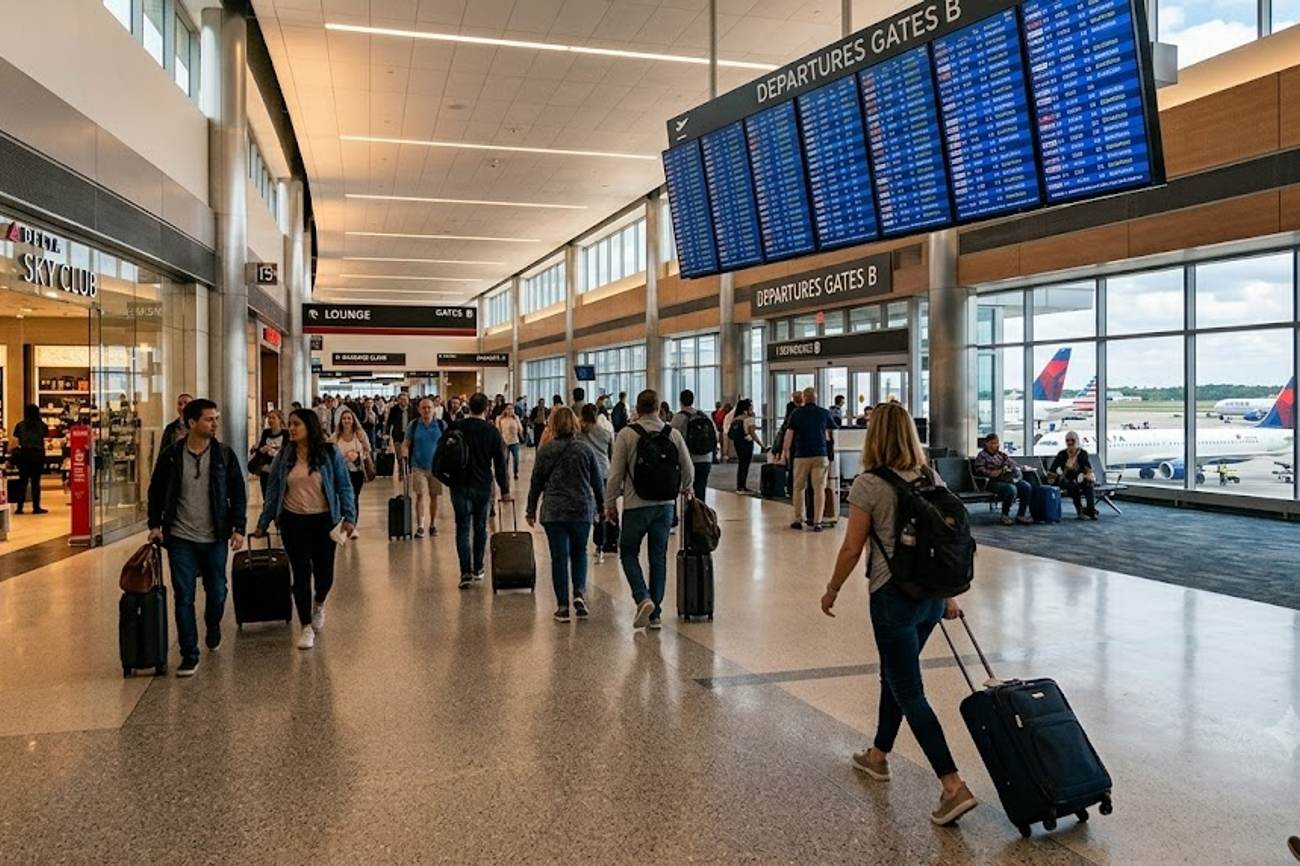
Image generated by AI
$9.8 billion in air ticket sales processed through national travel agencies signals a profound resurgence in high-value aviation demand. This figure, tracked by the Airlines Reporting Corporation (ARC), underscores a pivot toward complex, premium, and international itineraries that require professional mediation over simple point-to-point digital bookings. While the industry has long touted a return to pre-pandemic norms, the concentration of this revenue within specific geographic hubs reveals a widening gap between "gateway states" and the rest of the country.
The Hub-and-Spoke Dominance of the Sun Belt and Midwest
The current trajectory of U.S. aviation is not a uniform rise but a concentrated surge centered around a few critical infrastructure nodes. Georgia and Texas have emerged as the primary engines of this growth, leveraging a strategic combination of massive physical footprints and deep integration with legacy carriers.
Georgia's dominance is anchored by Hartsfield-Jackson Atlanta International Airport (ATL), which functioned as the primary catalyst for the state's lead, processing 106.3 million passengers in 2025. This volume is not accidental; it is the result of a symbiotic relationship between the state's infrastructure and the Delta Air Lines hub system. By positioning Atlanta as the central nervous system for both domestic transit and international arrivals, Georgia has captured a disproportionate share of the national travel spend.
Texas follows a similar blueprint but distributes its power across two massive nodes: Dallas/Fort Worth (DFW) and Houston Intercontinental (IAH). DFW alone handled 85.7 million passengers in 2025, driven largely by the American Airlines network. The Texas model demonstrates the efficacy of the "dual-hub" strategy, capturing both the corporate business traffic of Dallas and the energy-sector and international transit of Houston.
Passenger Volume and Market Distribution (2025)
The scale of these markets creates a gravitational pull that affects ticket pricing and route availability across the entire North American continent. The following data illustrates the sheer volume of movement through the top ten strongest air travel markets.
| State | Primary Airport(s) | 2025 Passenger Volume | Primary Demand Driver |
|---|---|---|---|
| Georgia | ATL | 106.3 Million | Delta Hub / Global Connectivity |
| Texas | DFW / IAH | 85.7 Million (DFW) | American Airlines Hub / Business |
| Illinois | ORD | 84.9 Million | United & American Hubs |
| Colorado | DEN | 82.4 Million | Leisure / Outdoor Tourism |
| California | LAX / SFO | 73.7 Million (LAX) | International Gateway / Entertainment |
| New York | JFK / LGA | 62.6 Million (JFK) | Financial Markets / Global Tourism |
| Florida | MCO / MIA | 113 Million (Combined) | Cruises / International Leisure |
| Nevada | LAS | 55 Million | Conventions / Entertainment |
| North Carolina | CLT | 53.6 Million | American Airlines Hub |
| Washington | SEA | 52.7 Million | Asia-Pacific Connectivity |
Expert Analysis: The "Complexity Premium" and the Return of the Agent
The $9.8 billion sales milestone is perhaps the most telling statistic in this report, but not for the reasons a casual observer might assume. Because this data specifically tracks transactions through accredited travel agencies—rather than direct-to-consumer airline websites—it reveals a critical shift in how people are traveling.
For the modern traveler, the direct consequence of this trend is a renewed reliance on professional intermediaries for "high-friction" journeys. The growth is not coming from simple domestic hops, but from complex, multi-city, and premium-cabin bookings. When a passenger books a multi-stop itinerary involving European holidays, Asian journeys, or African adventures, the risk of disruption increases. This creates a "complexity premium" where travelers are willing to pay for the security and route optimization provided by an agent.
Furthermore, the concentration of traffic in hubs like ATL, DFW, and ORD creates a pricing paradox. While these hubs offer the most connectivity, they are also the most susceptible to congestion and operational bottlenecks. As passenger volumes exceed 80 million per airport, the efficiency of the "hub-and-spoke" model is tested. For travelers, this means that while there are more flights available, the probability of delays increases. The pricing pressure created by this demand allows airlines to maintain high yields on premium business-class seats, even as they struggle with the logistical constraints of airport capacity.
The reliance on these ten states suggests a market consolidation. If you are traveling from a non-hub state, your journey is almost certainly being dictated by the operational health of one of these ten markets. A storm in Atlanta or a technical failure in Dallas now has a systemic ripple effect that can paralyze travel across several other states.
Key Takeaways
- Hub Hegemony: Georgia (ATL) remains the undisputed leader in volume with 106.3 million passengers, followed by Texas (DFW) at 85.7 million, cementing the Sun Belt as the center of U.S. aviation.
- Agency Resurgence: The $9.8 billion in agency-processed sales indicates a strong preference for professional planning in premium and international travel segments.
- Volume Concentration: A small group of airports—specifically ATL, DFW, ORD, and DEN—all handling over 80 million passengers each, act as the primary gateways for the majority of U.S. air traffic.
- Market Diversification: While business travel drives the Midwest and Texas hubs, Florida and Nevada are seeing massive growth driven by leisure, cruises, and conventions.
- Systemic Risk: The heavy reliance on a few massive hubs increases the vulnerability of the national network to localized disruptions and airport congestion.
FAQ: U.S. Air Travel Markets 2025
Why are ticket sales through travel agencies increasing? Travelers are booking more complex, international, and premium itineraries. These journeys often require expert route optimization and personalized assistance that automated booking tools cannot provide, leading to a rise in agency-mediated transactions.
Which U.S. state has the busiest air travel market? Georgia holds the top position, primarily due to Hartsfield-Jackson Atlanta International Airport (ATL), which handled 106.3 million passengers in 2025, making it the busiest airport in the United States.
How does hub concentration affect ticket prices? High demand at major hubs like DFW and ATL allows airlines to maintain higher prices for premium seats. However, it also means passengers in smaller markets often face higher costs due to the necessity of connecting through these expensive hubs.
What are the main risks to this growth? Future expansion is threatened by volatile fuel prices, airport congestion at major hubs, inflationary pressures on operating costs, and geopolitical instability affecting international routes.
The map of American travel is no longer a web, but a series of massive gravitational wells centered in a few key states.
Tags: Hartsfield-Jackson Atlanta International Airport, Dallas/Fort Worth International Airport, Airlines Reporting Corporation 2025, U.S. Aviation Hubs, Delta Air Lines, American Airlines
Related Travel Guides
- Switzerland Follows Many More as Namibia Strengthens Noordoewer Border Training for Global Tourist Growth
- Asia GCC Tourism Boom Surges as Gulf Destinations Unlock Record Asian Visitor Growth With Connectivity Visa and Luxury Travel Expansion
- Azerbaijan Makes F1 Travel Easier With Temporary Visa-on-Arrival Facility
Disclaimer
This article is for informational and educational purposes only. It does not constitute legal, financial, or professional advice. While we strive to provide accurate and up-to-date information, travel policies, regulations, and conditions change rapidly. Always verify information with official sources before making travel decisions. Nomad Lawyer makes no representations about the accuracy, reliability, completeness, or suitability of the information provided. Readers should consult qualified professionals for advice specific to their circumstances. The views expressed in this article are those of the author and do not necessarily reflect the views of Nomad Lawyer.
Preeti Gunjan
Contributor & Community Manager
A passionate traveller and community builder. Preeti helps grow the Nomad Lawyer community, fostering engagement and bringing the reader experience to life.
Learn more about our team →