
Yellowstone Sees Millions of Summer Tourists in 2026 as West Entrance Handles 43% of Vehicle Traffic
Yellowstone Sees Millions of Summer Tourists in 2026 as West Entrance Handles 43% of Vehicle Traffic

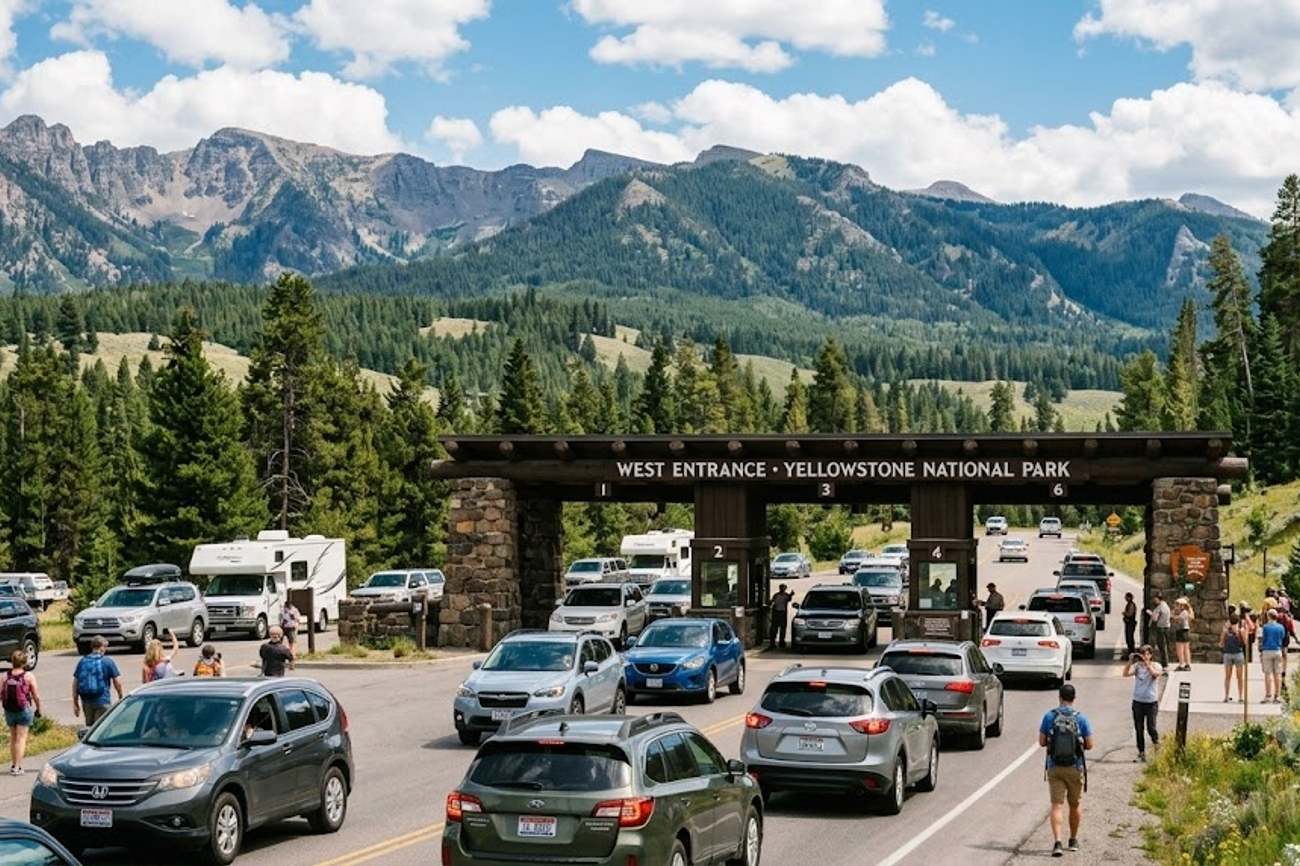
Image generated by AI
3.49 million recreation visits recorded through August 2026 signal a cooling, yet still immense, demand for Yellowstone National Park. This figure represents a 1.6% contraction compared to the 3.54 million visits logged during the same window in 2025, reflecting a reduction of approximately 56,000 visits. While the decline is modest, it suggests that the aggressive, post-pandemic surge in domestic nature tourism is finally stabilizing into a more sustainable, albeit high-volume, baseline.
The Stabilization of the Post-Pandemic Surge
The current data indicates that Yellowstone is no longer experiencing the exponential growth spikes seen in the early 2020s. To understand the current 2026 figures, one must look back to 2021, when the park recorded approximately 3.59 million recreation visits through August. The 2026 total of 3.49 million is roughly 100,000 visits lower than that 2021 benchmark.
This trend suggests a correction. During the immediate aftermath of global lockdowns, "revenge travel" drove unprecedented numbers of visitors toward wide-open spaces and national parks. The National Park Service (NPS) has historically struggled with the infrastructure demands of such spikes. The 1.6% dip from 2025 and the 3% drop in August alone—which saw 856,467 visits—indicate that the "peak of the peak" may have passed, moving toward a plateau of high-density tourism.
Gateway Logistics and Traffic Distribution
While total visitation is slightly down, the logistical pressure on specific entry points remains skewed. The distribution of automobile traffic reveals a heavy reliance on the West Entrance, which serves as the primary artery for travelers arriving from southwest Montana and eastern Idaho.
Through July 2026, the West Entrance processed nearly 425,000 recreational automobiles. When compared to the other traditional gateways, the dominance of this specific route becomes clear:
| Entrance Point | Recreational Automobile Entries (Through July 2026) | Percentage of Total Traditional Entries |
|---|---|---|
| West Entrance | 425,000 | ~43% |
| North Entrance | 244,000 | ~25% |
| South Entrance | 152,000 | ~14% |
| East Entrance | 84,000 | ~8% |
| Northeast Entrance | 75,000 | ~7% |
This concentration of traffic means that nearly half of all vehicle-based entries are funneled through a single gateway. For the surrounding communities of West Yellowstone and Island Park, this creates a precarious economic dependency. These towns function not just as service hubs but as the primary logistical filters for the park's most popular access point.
Expert Analysis: The Infrastructure-Demand Paradox
For the modern traveler, the 1.6% decline in visitation is a statistical curiosity; however, the logistical data reveals a systemic vulnerability. The fact that 43% of all vehicle entries occur via the West Entrance creates a "bottleneck economy." When nearly half a million cars enter through one gate, the resulting congestion impacts not only the visitor experience but the operational efficiency of the U.S. Department of the Interior.
The pricing pressure this creates is felt most acutely in the gateway towns. Because West Yellowstone handles a disproportionate share of the load, accommodation and short-term rental pricing in that specific corridor remains decoupled from the slight decline in overall park visitation. Even as total visits drop by 56,000, the demand for beds and fuel in West Yellowstone remains critical because the "entry preference" of the American traveler has not shifted.
Furthermore, the distinction between "recreation visits" and "unique individuals" is a vital metric for understanding park wear-and-tear. Because the NPS counts every entry—meaning a single visitor entering the park three times in one week counts as three visits—the actual number of unique humans in the park is lower than 3.49 million. Yet, the environmental impact is driven by the number of vehicles. With 425,000 cars at the West Entrance alone, the carbon footprint and road degradation are the primary concerns, regardless of whether total "visits" are slightly down.
For travelers booking this route, the direct consequence is a persistent "congestion tax" in the form of higher lodging costs and longer wait times at the West Entrance, despite the broader trend of moderating demand.
Key Takeaways
- Visitation Plateau: Yellowstone saw 3.49 million visits through August 2026, a 1.6% decrease from 2025 and a significant drop from the 3.59 million visits recorded through August 2021.
- August Peak: August remains a primary driver of traffic, recording 856,467 visits, though this was 3% lower than the previous year.
- West Entrance Dominance: The West Entrance is the undisputed primary gateway, accounting for approximately 43% of all recreational automobile entries through July (425,000 vehicles).
- Economic Dependency: Gateway communities like West Yellowstone and Island Park remain heavily reliant on this traffic, as the West Entrance handles nearly double the volume of the next busiest gate (North Entrance at 244,000).
- Metric Distinction: The 3.49 million figure represents "recreation visits" (total entries) rather than unique visitors, meaning individual repeat entries inflate the total.
FAQ: Yellowstone Visitation 2026
Is Yellowstone less crowded in 2026 than in previous years? Slightly. Visitation through August 2026 (3.49 million) is 1.6% lower than in 2025 and roughly 100,000 visits lower than the 2021 peak. However, the park remains extremely busy, particularly in August.
Which entrance is the busiest for driving into the park? The West Entrance is the busiest, recording nearly 425,000 recreational automobile entries through July 2026, which represents approximately 43% of all traditional entrance traffic.
When will the final 2026 visitation numbers be released? The National Park Service is expected to publish the comprehensive calendar-year statistics for 2026 in January 2027.
What is the difference between a "recreation visit" and a "visitor"? A recreation visit counts every time a person enters the park. If one person enters the park three separate times during their trip, the NPS records this as three recreation visits, not one unique visitor.
The shift from exponential growth to a high-volume plateau suggests that Yellowstone has reached its current operational ceiling.
#YellowstoneNationalPark #WestYellowstone #NationalParkService #MontanaTourism #WyomingTourism #USInteriorDepartment
Related Travel Guides
- Peru Captivates Soulful Adventurers During Inti Raymi Festivities Connecting Cusco And Sacred Valley Dawn Travel, Find Out Now
- UAE Expands Yas Island Tourism With $3.3 Billion Investment In New Attractions And Hotels
- Vietnam Aligns With Australia As VietJet Air Reduces Melbourne Flights For Winter 2026 Travel
Disclaimer
This article is for informational and educational purposes only. It does not constitute legal, financial, or professional advice. While we strive to provide accurate and up-to-date information, travel policies, regulations, and conditions change rapidly. Always verify information with official sources before making travel decisions. Nomad Lawyer makes no representations about the accuracy, reliability, completeness, or suitability of the information provided. Readers should consult qualified professionals for advice specific to their circumstances. The views expressed in this article are those of the author and do not necessarily reflect the views of Nomad Lawyer.
Raushan Kumar
Founder & Lead Developer
Full-stack developer with 11+ years of experience and a passionate traveller. Raushan built Nomad Lawyer from the ground up with a vision to create the best travel and law experience on the web.
Learn more about our team →