
Travel Report: Inflation Slows Tourism Growth Across Major US States
Inflation, high travel costs, and shifting consumer behavior cause a cooling of tourism growth in Washington, Florida, Hawaii, and Nevada.

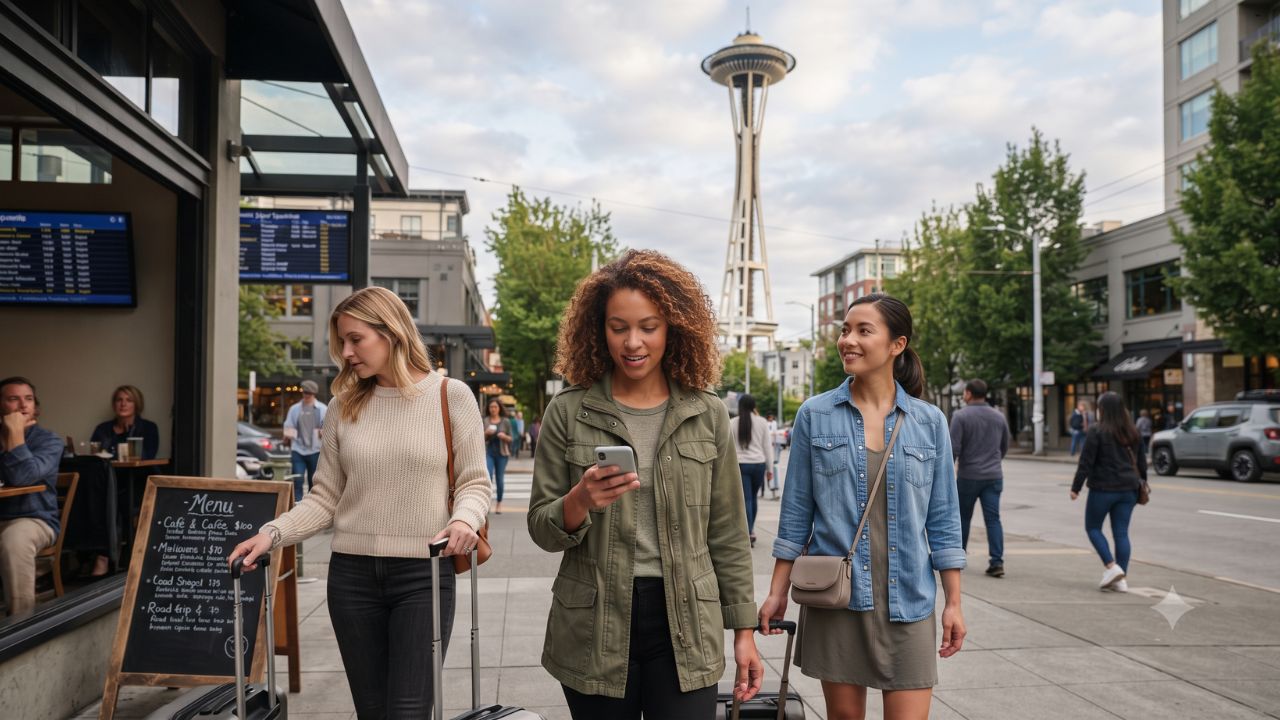
Image generated by AI
Inflation, high travel costs, and shifting consumer behavior cause a cooling of tourism growth in Washington, Florida, Hawaii, and Nevada. The US Travel Association indicates that rising consumer prices coordinate tourist behavior, supporting a transition toward shorter, regional, and drive-market trips across the country.
The Transition of Post-Pandemic Surges to Price-Sensitive Travel
A notable trend in North American travel planning is the transition of post-pandemic tourism surges into price-sensitive regional travel patterns. Historically, state tourism offices managed campaigns on the assumption that travelers would continue booking long-distance flights and multi-week luxury resort packages indefinitely, ignoring rising hotel rates, fuel price hikes, and credit reliance. In 2026, persistent household inflation and high cost-of-living index numbers encourage consumers to restructure their vacation budgets, choosing shorter drive-market day trips over expensive fly-in itineraries and reducing their average length of stay in premium destinations.
By coordinating marketing campaigns with budget-friendly travel corridors, regional destinations maintain overall visitor numbers. This value-driven travel model coordinates support for local state parks, independent motels, and community-run heritage attractions.
State-by-State Tourism Slowdown and Economic Parameters
Workforce and visitor tracking data reveal changing demand patterns across key regional markets:
- US Travel Outlook: The US Travel Association expects total travel spending to reach $1.37 trillion in 2026, with domestic leisure spending rising 0.9% in 2026.
- Washington State: Recorded nearly flat visitation at 111 million visits (+0.1%) in 2025, with leisure travel falling 0.8% and spending rising 0.9% to $25.3 billion.
- Florida Arrivals: Welcomed 34.01 million visitors in Q2 2026 (down 0.7%) and 73.5 million in the first half of 2026 (down 1.4% compared to 74.5 million in H1 2025). Domestic visitors hit 31.08 million in Q2 2026 and 67.33 million in H1 2026.
- Canadian Flight to Florida: Fell to 721,000 in Q2 2026 (down 4.2%) and 1.68 million in H1 2026 (down 13.9% compared to H1 2025), remaining well below the Q2 2019 baseline of 848,000 and H1 2019 baseline of 2.29 million.
- Overseas Arrivals in Florida: Softened to 2.21 million in Q2 2026 (down 3.7%), though H1 arrivals rose 2.2% year on year.
- Nevada/Las Vegas: Las Vegas recorded 38.5 million visitors in 2025, a 7.5% decline (with December falling 9.2%). Hotel occupancy averaged 80.3% (down 3.3 percentage points), while convention business supported 6 million attendees.
- California: International arrivals fell 5.0% in 2025, with spending down 4.4%. The state forecasts 275.5 million total visitors for 2026 (up 1.5%), but downside scenarios suggest Canadian arrivals could fall 6.1%.
- Hawaii: Air arrivals fell 3.2% in Q4 2025, 1.7% in March 2026, and 0.5% in April. June 2026 welcomed 858,577 visitors (+0.2%), but the average length of stay dropped 11.3% to 7.86 days, while daily spending rose 13.2% to $293 (total June spending: $1.98 billion, up 0.6%). First-half visitation rose 2.5% and spending rose 6.3%.
Visit Florida, under President and CEO Bryan Griffin, is focusing on rural tourism initiatives to offset international and Canadian declines.
US Tourism Markets and Sourcing Coordinates
The table below breaks down the project sectors, specific state metrics, recorded growth rates, visitor volume figures, Canadian segment drops, and coordinating authorities recorded on August 25, 2026:
| Core Project Sector | Specific State Metric | Recorded Growth Rate | Visitor Volume | Canadian Segment Drop | Coordinating Authority |
|---|---|---|---|---|---|
| Tourism economics | Washington: $25.3B spend | Spending up 0.9% | 111 million visits | Day trip growth focus | State Commerce Dept |
| Regional logistics | Florida: 73.5M H1 total | Visits down 1.4% | 34.01 million Q2 | 13.9% H1 drop | Visit Florida Board |
| Hospitality monitoring | Nevada: 38.5M annual | Visits down 7.5% | Occupancy: 80.3% | 3.3% occupancy drop | LVCVA Authority |
| Destination safety | California: 275.5M total | Expected up 1.5% | 5.0% int'l decline | 6.1% downside view | Visit California Office |
| Resource tracking | Hawaii: $1.98B June spend | June stay down 11.3% | 858,577 June pax | $293 daily spend rate | Hawaii Tourism (HTA) |
These coordinates outline the sectors, metrics, rates, volumes, drops, and authorities established for the state-level tourism programs.
Resource Stewardship and Eco-Aware National Travel
For the traveler, the benefit of choosing regional drive vacations over long-haul flights is the lower greenhouse gas emissions per passenger mile. Booking entry slots and national park permits digitally via official mobile apps prevents paper ticket waste.
Additionally, choosing certified green accommodations that practice rainwater harvesting protects local water supplies. Directing vacation budgets to family-run guest houses coordinates economic support for rural communities.
For comparison, you can explore the changing dynamics of Nebraska State Fair Returns to Grand Island for Summer 2026 to see how local state events attract regional drives. For transit updates, comparing travel scheduling matches other networks, such as Tokyo Haneda Airport Terminal Expansion Boosts Global Connections updates. This trend is similar to the tourism growth seen in other destinations, as detailed in our guide on the Malaysia Flight Fares Guide: Affordable Travel and Booking Tips regulations.
Budget Traveler Insider Tips: Navigating High Costs in the US
If you are planning to travel across the United States during this high-inflation period, keep these practical tips in mind:
- Opt for Midweek Park Visits: Visit popular state and national parks in Washington or Utah on Tuesdays and Wednesdays to secure cheaper nearby lodging.
- Explore Rural State Parks: In Florida, look beyond Orlando theme parks to historic sites like Bristol to experience local heritage without premium park tickets.
- Monitor Hotel Resort Fees: In Las Vegas, review the final booking terms carefully; advertised daily room rates often exclude mandatory resort and parking fees.
- Utilize Public Beach Access: In Hawaii, pack a reusable picnic and visit public county beaches to avoid high resort dining surcharges.
- Leverage Digital Fuel Apps: If undertaking a regional road trip in California, use mobile apps to compare gas station prices along your driving route.
Long-Term Outlook for US Regional Tourism Infrastructure
The long-term outlook for transit is focused on installing electric vehicle charging stations across rural tourist corridors, converting municipal bus systems to clean energy fleets, and upgrading digital booking platforms to handle high-density park ticket distributions. As domestic travelers continue to prioritize value, state transport offices and local tourism boards will cooperate to maintain passenger standards.
By developing sustainable transit options and protecting regional resources, the transportation sector aims to build a sustainable transport network.
FAQ
Is inflation causing tourism to decline across the United States?
Inflation and high travel costs are contributing to slower growth rates and shorter stays in several markets, though overall domestic spending remains resilient.
How much did Canadian arrivals to Florida drop in early 2026?
Canadian arrivals fell by 13.9% in the first half of 2026, totaling 1.68 million compared to the prior year.
What is the average length of stay trend in Hawaii?
In June 2026, the average length of stay in Hawaii dropped by 11.3% to 7.86 days, even as daily passenger spending rose to $293.
What was the visitor drop recorded in Las Vegas?
Las Vegas recorded a 7.5% annual decline in visitor volume, dropping to 38.5 million visitors, with hotel occupancy averaging 80.3%.
Stay updated on regional travel regulations and conservation campaigns shaping US transit.
Related Travel Guides
Disclaimer
This article is for informational and educational purposes only. It does not constitute legal, financial, or professional advice. While we strive to provide accurate and up-to-date information, travel policies, regulations, and conditions change rapidly. Always verify information with official sources before making travel decisions. Nomad Lawyer makes no representations about the accuracy, reliability, completeness, or suitability of the information provided. Readers should consult qualified professionals for advice specific to their circumstances. The views expressed in this article are those of the author and do not necessarily reflect the views of Nomad Lawyer.
Preeti Gunjan
Contributor & Community Manager
A passionate traveller and community builder. Preeti helps grow the Nomad Lawyer community, fostering engagement and bringing the reader experience to life.
Learn more about our team →