
US Island Destinations Drive Record Travel Spending During 2026 Labor Day Weekend
Explore how US islands like Galveston and Catalina drove end-of-summer tourism for Labor Day 2026, with TSA data and economic impact figures.

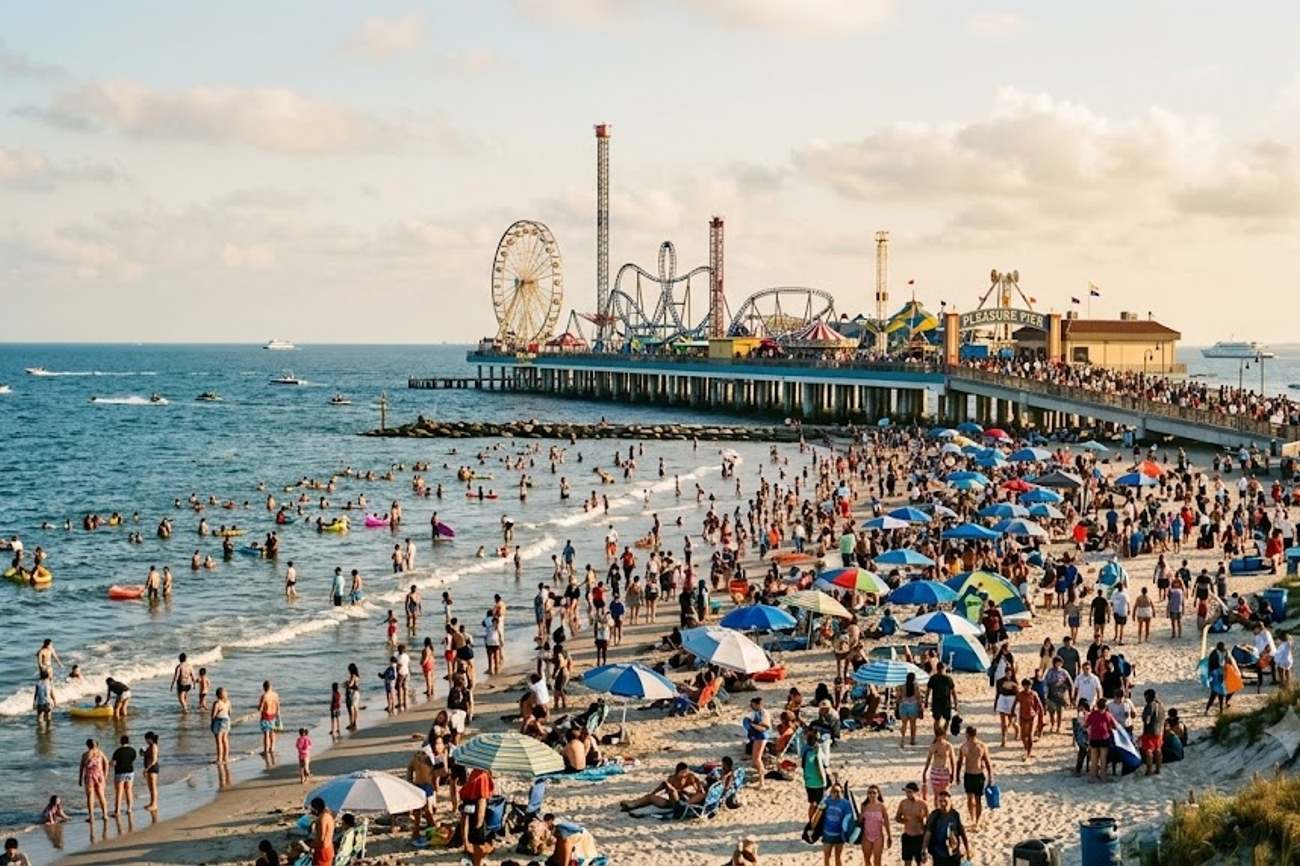
Image generated by AI
Island Destinations Anchor End-of-Summer Tourism Surge
Coastal and island destinations across the United States utilized the 2026 Labor Day weekend to capture a final wave of high-value seasonal travelers. From the Gulf Coast to the Pacific Northwest, locations including Galveston, Catalina Island, and the San Juan Islands deployed targeted festivals and outdoor events to encourage longer stays.
This strategic push serves as a financial bridge for local economies. By maximizing visitor spending before school routines resume and seasonal operations wind down, hotels, ferry services, and restaurants can stabilize revenue ahead of the quieter autumn months.
Air Travel and Spending Patterns
Data from the TSA highlights the massive scale of movement during the holiday window. Airport screenings peaked on the Friday before the holiday, reflecting a strong preference for short-term coastal escapes.
While domestic airfares saw a slight increase compared to 2025, international travel became more affordable, suggesting a shift in how Americans prioritized their final summer break. Overall, domestic leisure spending for 2026 is forecasted at $909 billion, a 0.9% increase over the previous year.
National US Travel Indicators (Labor Day 2026)
| Indicator | Verified Figure | Period | Meaning |
|---|---|---|---|
| US Airport Screenings | 2,702,095 | 3 September 2026 | TSA screenings before the weekend |
| US Airport Screenings | 2,815,644 | 4 September 2026 | Screenings on Friday before Labor Day |
| US Airport Screenings | 2,097,779 | 5 September 2026 | Screenings on Saturday |
| Total Screenings (3-Day) | 7,615,518 | 3–5 September 2026 | Calculated from TSA daily data |
| Domestic Return Airfare | $750 average | Labor Day 2026 | 2% increase vs 2025 |
| Top Destination Flights | Nearly $800 average | Labor Day 2026 | 20% increase year-on-year |
| International Return Airfare | $1,240 average | Labor Day 2026 | 4% decrease year-on-year |
| Roadside-Assistance Calls | 400,000+ | Labor Day 2025 | Previous year comparison |
| US Domestic Leisure Spending | $909 billion forecast | Full-year 2026 | Up 0.9% from 2025 |
| Total US Travel Spending | $1.37 trillion forecast | Full-year 2026 | Record annual projection |
Regional Strategies for Seasonal Gains
Different states employed varied tactics to attract the "last call" summer crowd. California’s Catalina Island and Georgia’s Tybee Island focused on high-energy events like luaus and beach bashes to drive ferry traffic and hotel occupancy.
In the North, Mackinac Island in Michigan and the San Juan Islands in Washington utilized "grand finale" promotions and float festivals to maintain momentum. These efforts ensure that the peak summer window is extended as far as possible into September.
Island-Specific Labor Day Activity
| Island or Destination | State | 2026 Labor Day Activity | Assessment |
|---|---|---|---|
| Catalina Island | California | Summer Send-Off Luau, beach parties, live music | Strong direct evidence |
| Tybee Island | Georgia | Two-night Beach Bash with concerts and fireworks | Strong direct evidence |
| Mackinac Island | Michigan | “Summer’s Grand Finale” and bridge events | Strong direct evidence |
| Hilton Head Island | South Carolina | End of Summer 5K, HarbourFest, concerts | Strong supporting evidence |
| San Juan Islands | Washington | Orcas Hotel program, Roche Harbor Float Fest | Supporting evidence |
| Block Island | Rhode Island | Holiday events and warm-season activity | Seasonal evidence |
| Martha’s Vineyard | Massachusetts | Jazz and Blues Summerfest, high ferry demand | Event-based evidence |
| Nantucket | Massachusetts | Traditional seasonal peak before slowdown | Strong seasonal pattern |
Economic Impact: The Galveston Model
Texas's Galveston Island exemplifies the economic importance of the holiday weekend. By integrating the Galveston Island Wine Festival (4–6 September) with its existing beach and historic attractions, the destination maximized its reach.
The financial stakes are high; based on 2025 data, the island attracts millions of visitors who generate significant direct spending and broader economic ripple effects.
Galveston Tourism Economics
| Indicator | Verified Figure | Reference Period |
|---|---|---|
| Total Visitors | 9.1 million | 2025 |
| Direct Visitor Spending | $1.3 billion | 2025 |
| Total Economic Impact | $1.7 billion | 2025 |
| Approx. Spending per Visitor | $143 | Derived from 2025 totals |
| Approx. Economic Impact per Visitor | $187 | Derived from 2025 totals |
| Holiday Ferry Capacity | Up to five vessels | Summer/Holiday demand |
| Seawall Parking Rate | $2 per hour | Current official rate |
| Max Daily Seawall Parking | $16 | Current official rate |
Key Takeaways
- Record Spending: Total US travel spending for 2026 is projected to reach a record $1.37 trillion.
- Air Travel Volume: Over 7.6 million passengers passed through TSA checkpoints between September 3 and 5, 2026.
- Strategic Timing: Island destinations use Labor Day as a "seasonal finale" to secure revenue before the autumn slump.
- Price Volatility: While domestic flights to top destinations spiked by 20%, international fares dropped by 4%.
FAQ
Why is Labor Day critical for US island tourism? It serves as the unofficial end of summer. Because school schedules resume and seasonal hours are reduced after this weekend, businesses must maximize revenue during this final peak.
How did airfares change for Labor Day 2026? Average domestic return fares were $750 (up 2%), while flights to leading destinations averaged nearly $800 (up 20%). Conversely, international fares averaged $1,240, a 4% decrease.
What was the economic impact of Galveston's tourism in 2025? Galveston saw 9.1 million visitors who spent $1.3 billion directly, resulting in a total economic impact of $1.7 billion.
Related Travel Guides
Disclaimer
This article is for informational and educational purposes only. It does not constitute legal, financial, or professional advice. While we strive to provide accurate and up-to-date information, travel policies, regulations, and conditions change rapidly. Always verify information with official sources before making travel decisions. Nomad Lawyer makes no representations about the accuracy, reliability, completeness, or suitability of the information provided. Readers should consult qualified professionals for advice specific to their circumstances. The views expressed in this article are those of the author and do not necessarily reflect the views of Nomad Lawyer.
Kunal K Choudhary
Co-Founder & Contributor
A passionate traveller and tech enthusiast. Kunal contributes to the vision and growth of Nomad Lawyer, bringing fresh perspectives and driving the community forward.
Learn more about our team →