
US Air Travel Paralyzed by 3,265 Flight Delays and 136 Cancellations: FAA Ground Stops and Turbulence Snarl Megahubs
Over 3,265 flight delays and 136 cancellations strike the United States as FAA ground stops, severe turbulence, and runway work snarl New York, Washington, and San Diego.

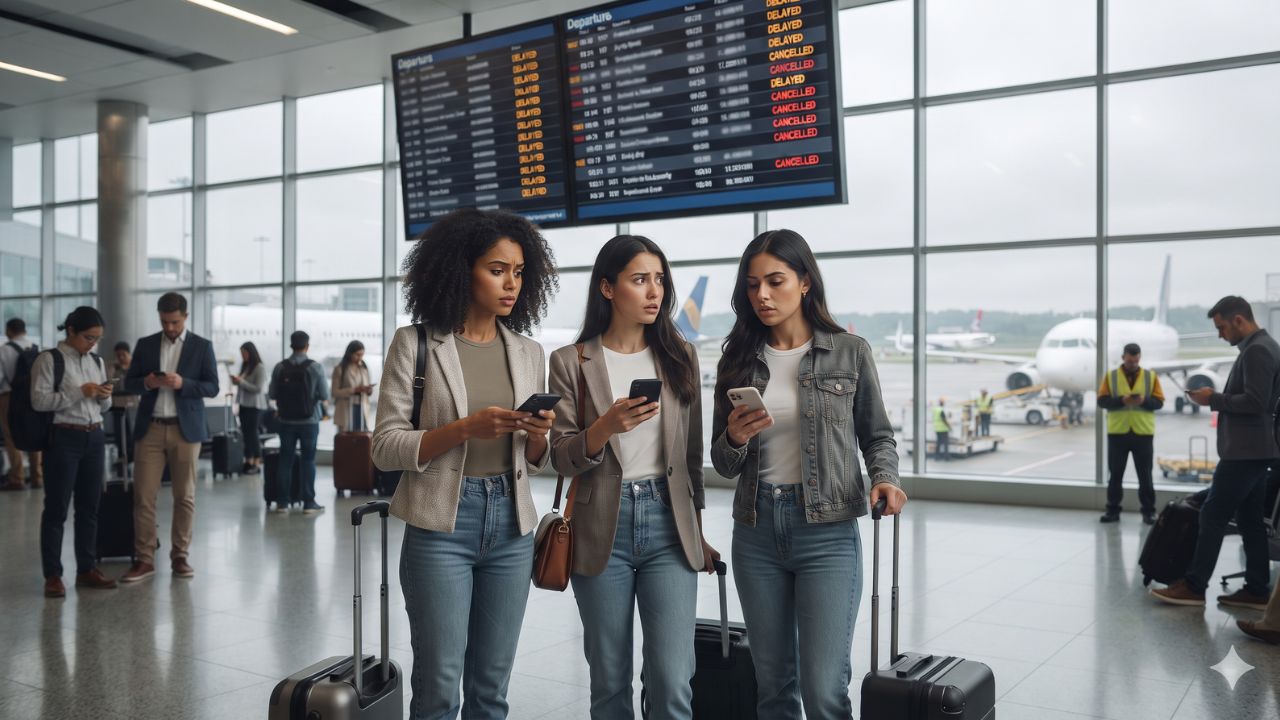
More than 3,265 domestic and international flights were delayed and 136 grounded across the United States on 17 October 2026, as high-velocity crosswinds, en-route clear-air turbulence, and airfield construction triggered extensive Federal Aviation Administration ground stops. Real-time tracking records compiled by FlightAware as of 3:33 pm ET revealed severe cascading disruptions across the national airspace system, with American Airlines bearing the heaviest scheduling penalty at 759 delays and United Airlines absorbing a nationwide-high 45 cancellations. From high-density northeastern corridors across New York and Washington to single-runway choke points in San Diego and the Pacific Northwest, air travelers encountered multi-hour gate holds, extensive terminal diversions, and missed connecting banks.
The nationwide breakdown underscores the compounding fragility of American commercial aviation during transitional autumn weather patterns. When severe upper-level atmospheric turbulence forces air traffic controllers to widen radar separation over the Mid-Atlantic, the resulting airborne delays rapidly overwhelm ground gate capacity at congested destination facilities. For business travelers, international transit passengers, and regional feeder customers, the resulting schedule degradation erased itinerary predictability, triggering involuntary overnight layovers and straining airport terminal resources from coast to coast.
Multi-Hub Air Traffic Choke Points: Wind Shear, Turbulence, and Runway Reconstruction
Operational notices published by the Federal Aviation Administration (FAA) indicate that multiple unrelated environmental and infrastructural constraints collided simultaneously across the continental United States:
In the New York metropolitan area, powerful surface gusts prompted the FAA Air Traffic Control System Command Center to issue formal ground stops for incoming flights bound for LaGuardia Airport (LGA) and John F. Kennedy International Airport (JFK). The wind-induced metering forced LGA to record 115 delays and eight cancellations, while JFK registered 163 delays and five cancellations. Concurrently, Newark Liberty International Airport (EWR) absorbed 179 delays and seven cancellations, with inbound flights suffering delays averaging 30 minutes and escalating rapidly due to severe convective weather and atmospheric turbulence within the Washington Air Route Traffic Control Center (ZDC ARTCC) airspace sector.
On the West Coast, San Diego International Airport (SAN) experienced acute operational friction, logging 224 delays and 14 cancellations. Because San Diego operates as the busiest single-runway commercial airfield in the nation, compacted scheduling demand forced departure delay rates to 30 percent and arrival delay rates to 33 percent, with delays expanding by 15-minute increments throughout the afternoon. Further north, Seattle-Tacoma International Airport (SEA) recorded 91 delays and three cancellations as scheduled runway maintenance and resurfacing reduced active pavement capacity, a constraint matched at Miami International Airport (MIA) where parallel runway construction similarly throttled hourly arrival rates.
Across the capital region, Ronald Reagan Washington National Airport (DCA) recorded 125 delays alongside 20 cancellations—the highest cancellation total among all continental US commercial airports—driving its departure delay rate to 20 percent. Meanwhile, offshore in the Caribbean, Luis Muñoz Marín International Airport (SJU) in San Juan, Puerto Rico, recorded 57 delays and 22 cancellations, leading all tracked domestic jurisdictions with an overall cancellation count driven by connecting feeder cancellations.
Airport Disruption Matrix and Carrier Performance Rankings
The disruption penalized regional carriers and legacy network operators unevenly, reflecting fleet positioning, hub geographic exposure, and regional feeder dependence.
The following data table breaks down operational delays, cancellations, and delay percentages across major US airports and airlines:
| Airport / Operating Airline | Recorded Flight Delays | Recorded Cancellations | Departure Delay Rate (%) | Arrival Delay Rate (%) | Primary Operational Delay Cause |
|---|---|---|---|---|---|
| San Diego International (SAN) | 224 delays | 14 cancellations | 30% departure delays | 33% arrival delays | Compacted demand on single commercial runway |
| Boston Logan (BOS) | 192 delays | 10 cancellations | 14% departure delays | 16% arrival delays | Northeast corridor flow control restrictions |
| Newark Liberty (EWR) | 179 delays | 7 cancellations | 7% departure delays | 22% arrival delays | ZDC ARTCC weather, wind shear, and severe turbulence |
| Los Angeles International (LAX) | 168 delays | 17 cancellations | 11% departure delays | 9% arrival delays | Transpacific and transcontinental arrival pacing |
| John F. Kennedy (JFK) | 163 delays | 5 cancellations | Not reported | Not reported | FAA ground stop due to high surface winds |
| Philadelphia International (PHL) | 150 delays | 10 cancellations | 13% departure delays | 14% arrival delays | Mid-Atlantic en-route airspace metering |
| Reagan Washington National (DCA) | 125 delays | 20 cancellations | 20% departure delays | 13% arrival delays | Slot-constrained perimeter gate holds (highest US mainland cancel total) |
| San Francisco International (SFO) | 115 delays | 12 cancellations | 8% departure delays | 10% arrival delays | West Coast oceanic approach pacing |
| New York LaGuardia (LGA) | 115 delays | 8 cancellations | 15% departure delays | 13% arrival delays | FAA ground stop due to wind gusts |
| Baltimore/Washington (BWI) | 98 delays | 6 cancellations | 18% departure delays | 15% arrival delays | En-route ZDC center air traffic holding |
| Seattle-Tacoma (SEA) | 91 delays | 3 cancellations | 15+ min increasing | Standard operations | Ongoing airfield runway construction delays |
| San Juan Luis Muñoz Marín (SJU) | 57 delays | 22 cancellations | 10% departure (5% cancel) | 13% arrival (4% cancel) | Highest overall cancellation count nationwide |
| American Airlines | 759 delays | 9 cancellations | 21% overall delay rate | Standard baseline | Heaviest delay count among US commercial airlines |
| Southwest Airlines | 562 delays | 13 cancellations | 16% overall delay rate | Point-to-point cascade | Network-wide turnaround delays |
| United Airlines | 257 delays | 45 cancellations | 8% delay rate | 1% cancellation rate | Highest total cancellations among all US airlines |
| PSA Airlines (American Eagle) | 130 delays | 23 cancellations | 17% delay rate | 3% cancellation rate | Regional feeder cancellations at DCA, CLT, and PHL |
| JetBlue Airways | 152 delays | 8 cancellations | 17% overall delay rate | Northeast concentration | Boston Logan and New York metro ground delays |
Analyzing airline statistics reveals that while American Airlines absorbed the highest volume of delays (759 flights, or 21 percent of its schedule), United Airlines suffered the sharpest schedule cancellations, grounding 45 mainline flights (a 1 percent cancellation rate). Concurrently, American's wholly owned regional subsidiary, PSA Airlines, logged 130 delays and 23 cancellations (a 3 percent cancellation rate), illustrating how regional carriers absorb the brunt of capacity cuts when mainline operators prioritize slot retention for larger aircraft.
Expert Analysis: Regional Feeder Vulnerabilities, Compensatory Rights, and Hub Recovery
The concentration of cancellations at slot-controlled airports like Reagan National (DCA) and Newark (EWR) exposes the deliberate triage strategy executed by network operations control centers during air traffic metering events.
For travelers booking this route, the direct consequence is that passengers on regional feeder flights—such as PSA Airlines regional jets connecting through DCA or Philadelphia—are statistically three times more likely to have their flights cancelled than passengers on mainline transcontinental routes. When the FAA imposes Ground Delay Programs (GDP) that slash hourly arrival runway slots, legacy airlines systematically sacrifice regional commuter flights to preserve slots for high-capacity, high-revenue Boeing 737 or Airbus A321 mainline rotations. A passenger booked on a 70-seat regional jet faces immediate cancellation, while the mainline flight operating on the same corridor remains active with an extended ground delay.
The pricing pressure this creates means that same-day hotel rates, rental car tariffs, and train fares along the Northeast rail corridor experience rapid surge pricing. In cities like Washington, D.C., Philadelphia, and New York, travelers stranded by sudden afternoon flight cancellations quickly exhaust remaining seat capacity on Amtrak's Northeast Regional and Acela train services, leaving remaining tickets priced at peak walk-up tariffs.
From a regulatory consumer protection standpoint, travelers navigating these disruptions must understand their legal entitlements enforced by the U.S. Department of Transportation. Under federal aviation regulations, cancellations and severe delays caused by weather, wind shear, and FAA ground stops are categorized as "uncontrollable" events, exempting airlines from providing cash compensation or mandatory hotel accommodation vouchers. However, if a cancellation or multi-hour delay is caused by airline-controllable factors—such as crew scheduling timeouts, maintenance issues, or aircraft turnaround failures—major US carriers are legally bound by their published customer service commitments to provide meal vouchers, ground transport, and complimentary hotel rooms for overnight delays. Furthermore, passengers whose flights are cancelled for any reason retain the statutory right to a full cash refund to their original form of payment if they choose not to accept the airline's alternative rebooking.
Key Takeaways
- 3,265 Delays and 136 Cancellations: Widespread flight disruptions paralyzed US air travel on 17 October 2026, driven by high winds, turbulence, and FAA ground stops.
- American and United Absorb Major Impacts: American Airlines logged 759 delays (a 21 percent delay rate), while United recorded a nationwide-high 45 flight cancellations.
- FAA Wind Ground Stops in New York: Severe gusts triggered formal ground stops at LaGuardia and JFK, while Newark arrival delays exceeded 30 minutes due to turbulence in ZDC airspace.
- Single-Runway Strain in San Diego: San Diego International logged 224 delays and 14 cancellations, with arrival delays reaching 33 percent due to compacted schedule demand.
- Reagan National Leads Mainland Cancellations: DCA logged 20 cancellations and 125 delays, as regional operators like PSA Airlines absorbed capacity reductions.
FAQ: US Flight Disruptions and FAA Ground Stops October 2026
What caused the widespread US flight delays on 17 October 2026?
Disruptions were caused by severe surface wind gusts at New York airports, severe en-route turbulence in Mid-Atlantic airspace, runway construction at Seattle and Miami, and compacted scheduling demand at San Diego.
Which airline experienced the highest number of delays and cancellations?
American Airlines recorded the highest delay count with 759 delayed flights, while United Airlines recorded the highest cancellation count with 45 cancelled flights.
Are airlines required to pay for hotel rooms during wind or weather delays?
No. Federal regulations classify wind, weather, and air traffic control ground stops as uncontrollable events, meaning airlines are not legally mandated to provide complimentary hotel vouchers.
Can I get a full cash refund if my flight is cancelled?
Yes. Under U.S. Department of Transportation regulations, passengers are entitled to a full prompt cash refund to their original payment method if their flight is cancelled and they decline rebooking.
When high winds, airspace turbulence, and packed runways intersect, America’s tightly wound aviation network proves how quickly minor weather fronts cascade into nationwide gridlock.
Related Travel Guides
Disclaimer
This article is for informational and educational purposes only. It does not constitute legal, financial, or professional advice. While we strive to provide accurate and up-to-date information, travel policies, regulations, and conditions change rapidly. Always verify information with official sources before making travel decisions. Nomad Lawyer makes no representations about the accuracy, reliability, completeness, or suitability of the information provided. Readers should consult qualified professionals for advice specific to their circumstances. The views expressed in this article are those of the author and do not necessarily reflect the views of Nomad Lawyer.
Raushan Kumar
Founder & Lead Developer
Full-stack developer with 11+ years of experience and a passionate traveller. Raushan built Nomad Lawyer from the ground up with a vision to create the best travel and law experience on the web.
Learn more about our team →