Pacific Northwest Gateway Comparison: How Portland, Seattle, Vancouver, and Bend Elevate Food, Nature, and Sustainable Tourism

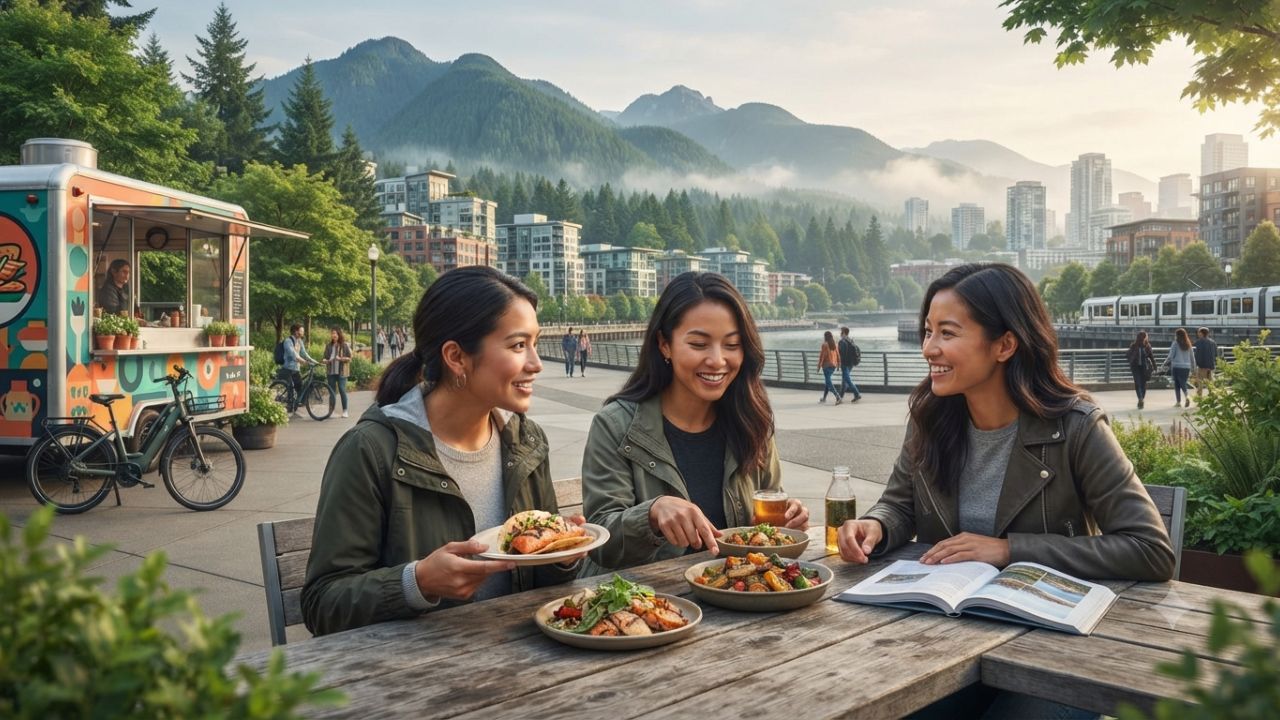
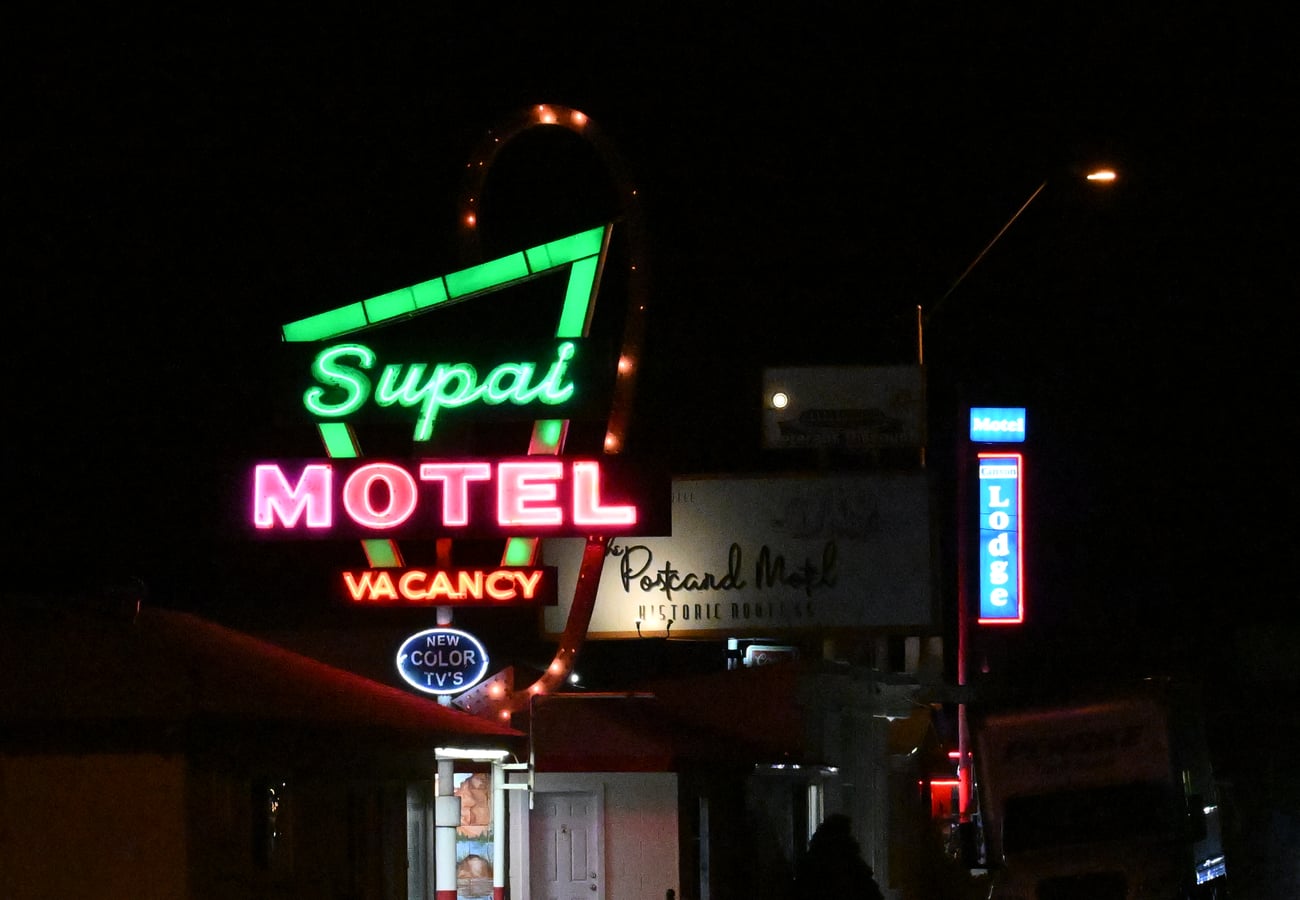
Image generated by AI
Economic and environmental data from Portland, Seattle, Vancouver, and Bend illustrate how four distinct gateways in the Pacific Northwest are shaping low-impact tourism models. Across the four destinations, visitor spending spans from $5.5 billion in Portland to $8.8 billion in Seattle.
[SEATTLE, Washington, Oct 7, 2026] — Comparative visitor data from primary tourism boards across the Pacific Northwest highlights how four key destinations—Portland, Seattle, Vancouver, and Bend—are deploying distinct approaches to manage culinary travel, municipal park infrastructure, and transport emissions.
While Seattle operates as the region's largest urban visitor economy with $8.8 billion in spending, Portland leverages a $1.18 billion food economy, Vancouver integrates formal municipal food policies alongside Michelin-starred dining, and Bend channels room tax collections directly into local community infrastructure.
| Destination | Visitor Spending / Economic Output | Nature & Park System Infrastructure | Primary Environmental Metric |
|---|---|---|---|
| Portland | $5.5 billion (2024) | 11,677+ park acres (7,895 natural) | 1.8M shared BIKETOWN & scooter trips |
| Seattle | $8.8 billion (2025 King County) | 6,441 park acres (489+ parks) | 56% GHG share from transportation |
| Vancouver | $544 million (2024 event output) | 250+ parks (11% of city land) | Municipal food policy with 72+ actions |
| Bend | 10.4% room tax collection rate | Cascade Range outdoor trail access | 44% GHG share from transportation |
Portland Combines a $1.18 Billion Food Economy With 11,677 Acres of Parks
Portland recorded more than 12.3 million overnight visitor trips in 2024, generating $5.5 billion in direct expenditure across lodging, dining, retail, transportation, and recreation.
Dining represents a primary driver of Portland's tourism economy, with visitors spending $1.18 billion at local food carts, independent restaurants, food halls, and regional craft breweries. Transportation accounted for an additional $1.4 billion in local visitor expenditure.
On the environmental front, Portland Parks & Recreation manages a park system spanning 11,677 acres, including 7,895 acres of natural areas, five watersheds, and over 1.2 million park trees. The urban canopy features more than 252,000 street trees—a 15 percent increase over the past decade.
To support low-carbon transit, Portland’s BIKETOWN e-bike and e-scooter network recorded approximately 1.8 million shared trips in 2024 across 248 stations equipped with 2,400 e-bikes.
| Portland Tourism & Infrastructure Metric | Verified Statistical Record | Economic & Urban Context |
|---|---|---|
| Total Visitor Expenditure (2024) | $5.5 billion | Covers accommodation, dining, retail, transit |
| Overnight Visitor Trips | 12.3+ million trips | Primary leisure and business volume |
| Food & Dining Expenditure | $1.18 billion | Second largest spending category after transit |
| Total Park System Area | 11,677+ acres | Includes 7,895 acres of natural urban forest |
| Urban Forest Canopy | 252,000+ street trees | 15% growth recorded over past decade |
| Shared Micromobility Trips | 1.8 million trips (2024) | Supported by 2,400 e-bikes across 248 hubs |
Seattle Generates $8.8 Billion Visitor Economy Alongside 6,441 Park Acres
Seattle and King County welcomed 39.7 million visitors in 2025. Visitor spending remained flat at $8.8 billion, supporting 68,623 jobs and generating $840 million in state and local tax revenue.
Seattle Parks and Recreation maintains 6,441 acres across 489 public parks, covering approximately 12 percent of the city's total land area and incorporating 120 miles of walking trails. Discovery Park serves as an urban nature showcase, preserving 534 acres of coastal bluffs, forests, and tidal beaches within city limits.
| Seattle & King County Economic Indicator | 2025 Verified Figure | Operational Significance |
|---|---|---|
| Total Visitor Volume | 39.7 million visitors | Combined city and regional county traffic |
| Total Direct Spending | $8.8 billion | Largest visitor economy among the four hubs |
| Tourism-Supported Employment | 68,623 jobs | Direct hospitality, food, and retail roles |
| State & Local Tax Revenues | $840 million | Offsets municipal tax obligations |
| Park System Footprint | 6,441 acres (489+ parks) | 12% of total city land mass area |
| Transport GHG Contribution | 56% of city core emissions | Core challenge targeted by Link light rail expansion |
However, Seattle faces ongoing transport emission challenges. Transportation accounts for 56 percent of the city’s core greenhouse-gas emissions.
Municipal updates note a 10 percent reduction in vehicle miles traveled compared to 2022 levels, alongside increased Link light-rail ridership. In food policy, the Seattle Food Action Plan released its first formal progress report in 2026, targeting urban agriculture expansion and food waste reduction.
Vancouver Integrates 12 Michelin-Starred Restaurants With 250 City Parks
Vancouver presents a cross-border comparison, combining coastal urban density with formal municipal environmental policies. Destination Vancouver reported that 187 supported events generated $544 million in economic output in 2024, contributing $283 million in GDP, $87 million in government tax revenue, and supporting 4,010 full-time equivalent jobs. Visitor spending accounted for 82 percent of total event economic impact.
Vancouver manages over 250 public parks covering 11 percent of the city's land mass. The city operates a structured municipal food strategy containing more than 72 action items across five policy goals, defining "local food" as products raised, grown, or processed within British Columbia.
In fine dining, the 2025 MICHELIN Guide Vancouver selection recognized 12 Michelin-starred establishments within an overall guide covering 76 recommended restaurants across 22 distinct cuisine types.
| Vancouver Metric / Policy Indicator | 2024–2025 Data | Strategic Value Proposition |
|---|---|---|
| Supported Event Economic Output | $544 million (187 events) | Generates $283M GDP & 4,010 FTE jobs |
| Visitor Event Spend Share | 82% of economic impact | Demonstrates event-driven tourism value |
| Park System Coverage | 250+ parks (11% land mass) | Waterfront seawalls, beaches, & gardens |
| Municipal Food Strategy | 72+ action initiatives | Regulates BC-local food procurement standards |
| MICHELIN Guide Selections | 12 Starred (76 total) | Spans 22 distinct international cuisine types |
Bend Allocates 10.4 Percent Room Tax to Fund Community Infrastructure
Bend alters the scale of the Pacific Northwest comparison, offering an outdoor-focused travel model centered on Central Oregon's Cascade Mountains and Deschutes River.
Visitors to Bend pay a 10.4 percent visitor room tax, with 64.6 percent of total collections directed into the city's General Fund to support public services. Additional room tax revenues fund regional tourism promotion, arts initiatives, and sustainable visitor projects.
| Bend Tourism & Environmental Factor | Official Metric | Community & Transit Reality |
|---|---|---|
| Visitor Room Tax Rate | 10.4% tax collection | 64.6% allocated to city General Fund |
| Local Food Dollar Retention | ~70 cents per dollar spent | Visit Bend local procurement multiplier data |
| Transport GHG Emissions Share | 44% of total local emissions | Transport emissions grew 28% from 2016 to 2021 |
| Total Municipal Carbon Output | 1.3 million metric tonnes | Addressed via EV readiness & mobility hub planning |
Economic reports from Visit Bend indicate that purchasing local food retains approximately 70 cents of every dollar within the local community economy.
However, outdoor tourism in Bend relies heavily on private vehicle transport. Transportation accounts for 44 percent of local greenhouse-gas emissions (1.3 million metric tonnes recorded in 2021), reflecting a 28 percent increase in transport emissions between 2016 and 2021. In response, municipal planners are implementing EV charging networks and regional transit mobility hubs.
| Traveller Priority | Recommended City | Operational Justification |
|---|---|---|
| Food-Led Urban Exploration | Portland | Dense food cart culture & $1.18B dining spend |
| Metropolitan Parks & Transit | Seattle | 6,441 park acres & Link light rail access |
| Premium & Sustainable Dining | Vancouver | 12 Michelin-starred venues & BC local food policy |
| Outdoor Adventure & Nature | Bend | Direct access to Cascade trails & Deschutes River |
| Shared Active Micromobility | Portland | 1.8 million shared e-bike/scooter trips |
Why This Matters: What It Means for Traveler Logistics and Itineraries
For travelers planning a Pacific Northwest vacation, comparing these four destinations helps align personal preferences with logistics:
- For culinary-focused travel: Portland offers neighborhood food cart exploration supported by $1.18 billion in annual dining spend, while Vancouver delivers fine-dining options featuring 12 Michelin-starred establishments.
- For urban nature seekers: Seattle combines metropolitan scale with 6,441 acres of parks (including Discovery Park's 534 coastal acres), while Portland features 11,677 acres of urban natural areas accessible via public transit.
- For outdoor adventure and sustainability: Bend provides direct access to Cascade Mountain trails while reinvesting 64.6 percent of its 10.4 percent room tax into public community funds.
Related Travel Guides
U.S. Domestic Airfares Drop in Q2 2026 as Airline Yields Stabilize Across Key Hubs
Canada Coastal Tourism Growth Drives Regional GDP Across Nova Scotia and British Columbia
10 Best Eco-Friendly Road Trips in the Pacific Northwest, According to Reddit
This article is for informational purposes. Flight routes, passenger regulations, visa rules, and transit advisories are subject to change by airlines and aviation authorities. Readers are advised to verify schedules and travel documentation with relevant carriers and border agencies before departure.
Related Stories
15 Best Places to Visit in Canada According to Quora: From Iconic Rockies to Secret Frontiers
10 Epic USA Road Trips That Can Take Weeks Reddit Travelers Recommend in 2026