Kyoto Hotel Rates Climb as Occupancy Slips: How Japan's New Tiered Accommodation Tax and Regional Shifts Impact Travel Budgets

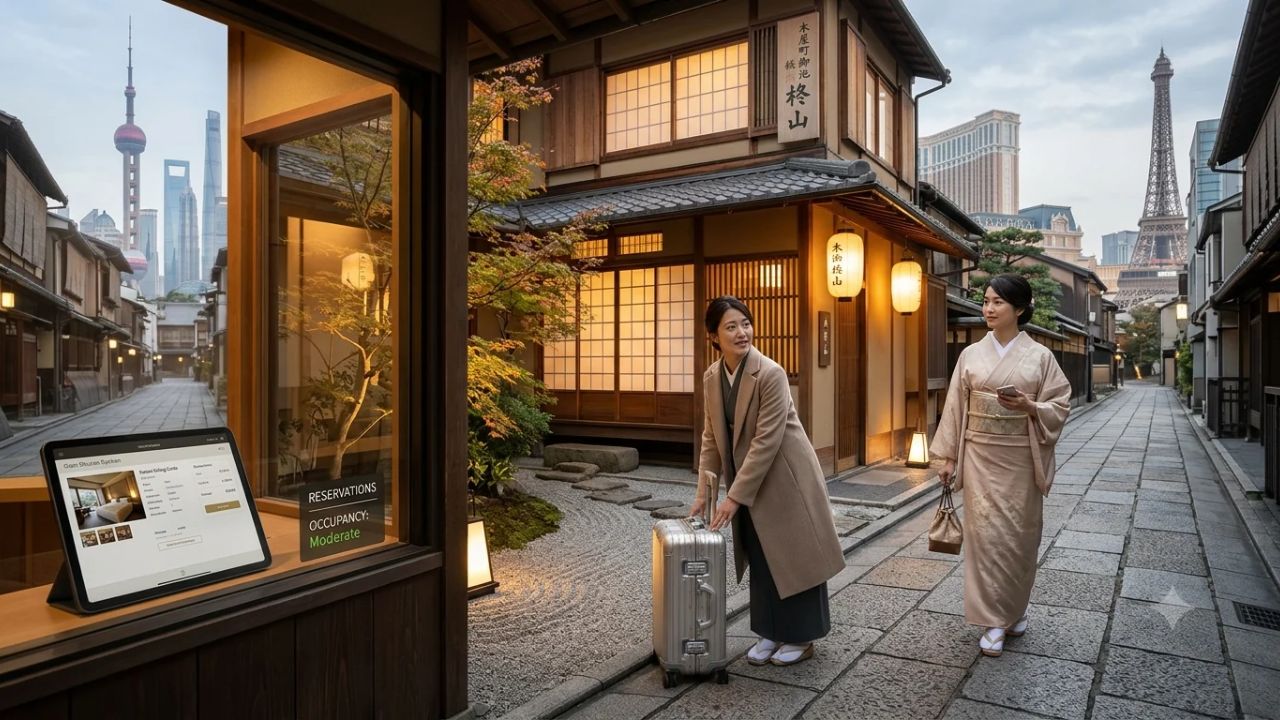
KYOTO, Japan — Travelers booking accommodation in Japan’s cultural capital are encountering a striking economic paradox: hotel room rates are climbing significantly even as overall room occupancy declines. Official hospitality data surveying 117 major Kyoto hotels representing 17,585 rooms—nearly half of the city’s commercial room inventory—reveals that the Average Daily Rate (ADR) rose 5.4 percent year-on-year in September 2026, climbing from ¥18,335 in September 2025 to ¥19,333 before consumption and local lodging taxes. Over the exact same period, hotel occupancy contracted from 83.5 percent down to 79.7 percent. This divergence means individual visitors paid noticeably higher nightly room rates during an autumn shoulder season marked by more vacant rooms across the city.
Compounding this pricing shift is Kyoto’s overhauled municipal accommodation tax structure, implemented on 1 March 2026. Replacing the city's previous flat levies with an aggressive, five-tier progressive ladder that reaches up to ¥10,000 per person per night for luxury rooms, the tax framework creates substantial pricing thresholds that directly alter the final checkout bill. Parallel dynamics are unfolding across key Asia-Pacific destinations—including Shanghai, Macao, Taiwan, Singapore, and the Maldives—where shifting guest demographics, statutory hospitality surcharges, and disguised service fees are forcing international travelers to re-examine how lodging costs are calculated.
KYOTO HOTEL MARKET METRICS: SEPTEMBER 2026 VS 2025
| Metric | September 2025 | September 2026 | Year-on-Year Change |
|---|---|---|---|
| Survey Scope | 117 Major Hotels | 117 Major Hotels | 17,585 Rooms (~47%) |
| Average Daily Rate (ADR) | ¥18,335 (Pre-tax) | ¥19,333 (Pre-tax) | +5.4% (+¥998/Room) |
| Room Occupancy Rate | 83.5% | 79.7% | -3.8 Percentage Pts |
| Revenue Per Available Room (RevPAR) | ¥15,310 | ¥15,408 | +0.6% (+¥98/Room) |
| Total Recorded Guest Nights | 821,610 Nights | 781,791 Nights | -4.8% (-39,819) |
| Domestic Japanese Guest Nights | 284,435 Nights | 310,946 Nights | +9.3% (+26,511) |
| International Guest Nights | 537,175 Nights | 470,845 Nights | -12.3% (-66,330) |
| International Share of Nights | 65.4% | 60.2% | -5.2 Percentage Pts |
The Economics of the Kyoto Lodging Paradox
To understand how travelers can feel a sharp price increase while hotels see only modest revenue expansion, one must examine the distinction between the Average Daily Rate (ADR) and Revenue Per Available Room (RevPAR).
When a traveler books a room, they pay the ADR—the price of that single occupied room. In September 2026, guests paid an average of ¥998 more per night than they did twelve months earlier. For an international couple spending five nights in Kyoto, this base increase represents roughly ¥5,000 in additional lodging expenses before local taxes, even during a month when roughly one in five hotel rooms sat unoccupied.
For hotel operators, however, the financial reality looks very different. An empty room generates zero revenue while still incurring fixed operating overheads such as building maintenance, property leases, and baseline utilities. When hotel managers divide total room revenue across every room in the property—both occupied and vacant—the resulting RevPAR figure reached ¥15,408 in September 2026, compared to ¥15,310 in September 2025. This translates to an annual revenue gain of just 0.6 percent, or a mere ¥98 per available room.
This dynamic demonstrates that hoteliers have pursued rate-driven yield strategies rather than volume-driven occupancy models. Confronted with rising labor costs, utility price increases, and specialized staff shortages across housekeeping and front-desk management, operators have chosen to protect operational profit margins by raising nightly rates on the rooms they do sell, rather than discounting prices to chase maximum occupancy.
KYOTO TIERED ACCOMMODATION TAX STRUCTURE (MARCH 2026)
| Entity / Facility | Delays | Cancellations | Details |
|---|---|---|---|
| Tier Level | Room Rate Per Person/Night | Municipal Tax Rate | Target Property Class |
| Tier 1 (Economy) | Under ¥6,000 | ¥200 per Person/Night | Hostels, Pod Hotels |
| Tier 2 (Standard) | ¥6,000 to ¥19,999 | ¥400 per Person/Night | Business & 3-Star |
| Tier 3 (Midscale) | ¥20,000 to ¥49,999 | ¥1,000 per Person/Night | Full-Service 4-Star |
| Tier 4 (Upscale) | ¥50,000 to ¥99,999 | ¥4,000 per Person/Night | Luxury Hotels, Ryokan |
| Tier 5 (Ultra-Lux) | ¥100,000 and Above | ¥10,000 per Person/Nt | Heritage Suites, Villas |
The New Tiered Accommodation Tax: Navigating the ¥100,000 Cliff
The introduction of Kyoto’s overhauled municipal accommodation tax (shukuhaku-zei) on 1 March 2026 added a structural layer of expense that catches unprepared travelers by surprise. Designed to mitigate overtourism pressures and generate municipal revenue for urban infrastructure maintenance, the new framework replaces Japan's traditional flat rates with five distinct tax bands.
The most dramatic feature of the system is the sharp pricing threshold separating Tier 4 from Tier 5 at the ¥100,000 mark. Consider a solo traveler reserving a boutique suite in the historic Gion district:
- If the qualifying room rate is billed at ¥99,999, the booking falls into Tier 4, incurring a municipal tax of ¥4,000 per night. The total bill before national consumption tax comes to ¥103,999.
- If the qualifying room rate increases by just two yen to ¥100,001, the booking crosses into Tier 5. The municipal tax instantly jumps to ¥10,000 per night, pushing the total bill to ¥110,001.
- A tiny price difference of two yen in the room tariff triggers an additional ¥6,000 tax liability every night. Over a four-night luxury stay, crossing that single pricing threshold adds ¥24,000 in local municipal tax.
How Double Occupancy and Ryokan Packages Are Calculated
Importantly for couples and families, Kyoto calculates the accommodation tax on a per-person, per-night basis rather than per room. This rule creates significant budgeting advantages when understood in advance:
Picture two adults sharing a luxury suite or traditional inn (ryokan) in Arashiyama billed at a total nightly room rate of ¥100,000. While the invoice total reaches the six-figure mark, dividing the cost equally assigns a qualifying lodging rate of ¥50,000 to each individual guest. Consequently, each guest falls into the Tier 4 bracket (¥4,000 per person), producing a combined tax of ¥8,000 per night. Had the tax applied to the room as a single entity, the bill would have attracted the ¥10,000 Tier 5 bracket. Over a two-night weekend stay, this per-person calculation saves the traveling couple ¥4,000 in taxes.
Another vital calculation rule concerns meal packages. In traditional ryokan, bookings frequently include elaborate multi-course Kaiseki dinners and traditional Japanese breakfasts. Under Kyoto municipal tax regulations, the accommodation tax applies strictly to the room tariff and its directly linked lodging service charges. It excludes the cost of meals, beverages, and the 10 percent national consumption tax.
When evaluating half-board ryokan packages quoted at ¥120,000 per night for two guests, savvy travelers should request an itemized billing breakdown from the innkeeper. If the invoice designates ¥50,000 for Kaiseki dining and ¥70,000 for the room (¥35,000 per person), both guests fall into Tier 3 (¥1,000 per person), owing a combined ¥2,000 in tax per night. If the inn lumps the entire package together without separating food and beverage, guests risk being taxed at Tier 4 levels.
How Municipal Tax Receipts Shape the Kyoto Visitor Experience
The revenue generated by this aggressive tax structure has transformed Kyoto’s municipal finances. In the 2026 fiscal year budget, Kyoto City projected accommodation tax receipts to surge to ¥13.2 billion, more than doubling the ¥5.9 billion collected in the previous municipal budget.
Visitors can observe these tax revenues actively deployed throughout the city before ever checking into their rooms. Municipal funds directly finance:
- The operation of dedicated express tourist bus lines connecting Kyoto Station directly to Kiyomizu-dera, Ginkaku-ji, and Kinkaku-ji, bypassing crowded residential commuter routes.
- Daily intensive litter collection, public waste infrastructure, and historical preservation teams throughout high-density cultural quarters like Gion, Pontocho, and the bamboo groves of Arashiyama.
- Multilingual crowd-monitoring systems and real-time congestion alert monitors installed at major bus terminals and rail stations.
GUEST DEMOGRAPHIC SHIFTS: WHO SLEPT IN KYOTO
| Entity / Facility | Delays | Cancellations | Details |
|---|---|---|---|
| Origin Group | September 2025 Nights | September 2026 Nights | Shift & Strategic Note |
| Domestic Japanese | 284,435 Nights (34.6%) | 310,946 Nights (39.8%) | +9.3% Growth |
| (Local Travelers) | Strong weekend demand | ||
| International | 537,175 Nights (65.4%) | 470,845 Nights (60.2%) | -12.3% Contraction |
| (Overseas Inbound) | Sensitivity to pricing | ||
| Total Combined | 821,610 Nights | 781,791 Nights | -4.8% Overall Volume |
| (All Surveyed) | Rate over volume shift |
Demographic Reversals: Dispelling the Foreign Influx Myth
A widespread assumption among travelers is that surging room rates across Japan are driven by an uncontrollable wave of foreign tourists competing for scarce beds. However, the September 2026 Kyoto hotel data paints a very different picture.
During September, international travelers logged 470,845 guest nights across the surveyed hotels, representing a notable 12.3 percent contraction compared to the 537,175 international nights recorded in September 2025. While overseas visitors still accounted for the majority of hotel stays—representing roughly three out of every five guest nights (60.2 percent)—their total volume declined substantially.
In contrast, domestic Japanese travelers spent 310,946 nights in Kyoto hotels, marking a 9.3 percent increase over the previous year. Japanese corporate travelers, regional sightseers, and domestic autumn foliage planners expanded their presence in the city, partially filling the void left by departing international tour groups.
This shift indicates that higher hotel prices are not simply the product of demand outpacing capacity. Instead, they reflect a structural realignment in hotel operating models. Facing higher operating overheads and an expanded tax environment, hotels have maintained high headline rates, accepting lower overall occupancy. Confronted with elevated lodging costs and steep tax bands, a segment of international travelers has adjusted itineraries, opting to base themselves in nearby Osaka, Kobe, or Otsu in Shiga Prefecture, making day trips into Kyoto via the JR Tokaido-Sanyo Line and private Keihan and Hankyu rail corridors.
REGIONAL ASIA-PACIFIC HOSPITALITY PRICING MATRIX
| Destination | Key Pricing Metric | Occupancy & Volume Trends | Hidden Charges & Tax |
|---|---|---|---|
| Kyoto, Japan | ADR: ¥19,333 (+5.4% YoY) | Occupancy: 79.7% (-3.8pts) | Tiered Tax: ¥200 to |
| RevPAR: ¥15,408 (+0.6% YoY) | Foreign nights: -12.3% | ¥10,000/person/night | |
| Shanghai, CN | 5-Star ADR: 1,017 RMB/night | 5-Star Occupancy: 72.4% | 29% Premium over |
| All-Hotel ADR: 790 RMB/night | (Dipped from 73.1% YoY) | Citywide Average | |
| Macao SAR | Holiday ADR: 1,677.3 MOP | Golden Week Occ: 91.3% | Day-trippers: 61.5% |
| (-1.7% YoY During Peak) | Peak Day: 97.0% (Oct 2) | Non-gaming spend up | |
| Taiwan | National ADR: NT$3,101 | Mid-Autumn Bookings: 67.1% | 80% of Hotels Price |
| (+1.5% YoY in Q1 2026) | Chiayi / Tainan: >80% | Below Statistical Av | |
| Singapore | Gazetted ADR: S$284.40 | Gazetted Occ: 91.2% | Mandatory "++" Rule: |
| Large Hotels: S$311.00 | Small Hotels: S$148.10 | +10% Serv + 9% GST | |
| Maldives | Resort Nights: 717,240 (Sep) | Q3 Combined: 2.78M (+3.5%) | Green Tax: US$12/day |
| (-2.5% YoY Single Month) | Steady Luxury Demand | vs US$6 Local + 17% |
Regional Hospitality Comparisons Across the Asia-Pacific Basin
Kyoto’s evolving hotel pricing landscape mirrors wider structural shifts across major Asia-Pacific destinations, where understanding nuanced rate structures can save travelers hundreds of dollars.
1. Shanghai: Putting a Real Number on the Five-Star Upgrade
In mainland China’s premier financial hub, the price premium for luxury accommodation follows a consistent, measurable spread. In September 2026, Shanghai’s five-star hotels generated an average of 1,017 yuan per occupied room night, compared to 790 yuan across all star-rated properties throughout the city. This leaves a defined premium of 227 yuan per night, or approximately 28.7 percent, for travelers deciding whether to step up from four-star corporate lodging to full luxury amenities.
Examining performance over the first nine months of 2026 confirms this stability: five-star rooms averaged 996 yuan per night, while the wider star-rated market averaged 772 yuan. For a couple planning a three-night city break, booking five-star lodging totals 2,988 yuan compared to 2,316 yuan in standard star-rated hotels. The resulting 672-yuan difference allows travelers to evaluate whether private lounge access, concierge services, and health facilities justify the incremental spend. Parallel to Kyoto, Shanghai’s five-star occupancy dipped slightly from 73.1 percent to 72.4 percent while rates climbed, showing that high-end hotels across Asia are prioritizing rate integrity over full capacity.
2. Macao: High Occupancy with Softening Peak Rates
Macao presents a fascinating counterpoint to Kyoto’s rate gains. During the Golden Week holiday spanning 1 to 7 October 2026, Macao’s hotels achieved an average occupancy rate of 91.3 percent—a 3.1 percentage point increase over the previous Golden Week—peaking at 97.0 percent on 2 October.
Yet, despite packed resorts along the Cotai Strip, the holiday ADR fell 1.7 percent to approximately 1,677.3 patacas (MOP). The presence of massive holiday crowds did not translate into higher room rates because the profile of visitors has shifted toward day-trippers. Between January and September 2026, Macao welcomed 32.18 million arrivals. However, 19.78 million of these visitors (61.5 percent) were same-day excursions from neighboring Guangdong and Hong Kong, up 14.5 percent year-on-year. Overnight stays held steady at 12.40 million.
This dynamic explains why crowded streetscapes in Macao offer little guidance on hotel pricing. While non-gaming visitor spending reached 67.56 billion MOP (with retail shopping taking 44.7 percent), overnight visitors spent an average of 3,970 MOP across their trip, compared to 927 MOP for day-trippers. High-end five-star resorts maintained 93.5 percent occupancy through September by bundling entertainment and dining vouchers rather than driving up base room tariffs.
3. Taiwan: The Skewed Average and Holiday Booking Velocity
In Taiwan, understanding the statistical distribution of hotel rates is essential for accurate trip planning. In the first quarter of 2026, the national average room rate stood at NT$3,101, representing a modest 1.5 percent rise year-on-year. However, industry audits indicate that roughly eight out of every ten licensed hotels in Taiwan charge rates well below this figure. The national average is pulled upward by a concentrated tier of ultra-luxury hot spring resorts in Beitou and Sun Moon Lake. Travelers who filter accommodation searches starting at the NT$3,101 mark inadvertently filter out 80 percent of quality budget and midscale hotels across Taipei, Taichung, and Kaohsiung.
Additionally, holiday demand in Taiwan accelerates with extreme speed. During the Mid-Autumn holiday in late September, nationwide accommodation bookings surged from 62.2 percent to 67.1 percent in a single week. In regional tourism centers like Chiayi City (82.1 percent), Pingtung County near Kenting National Park (81.8 percent), and historic Tainan (80.0 percent), available rooms vanished rapidly, highlighting that availability constraints in Taiwan occur at localized regional levels rather than across the island as a whole.
4. Singapore: The "Plus Plus" (++) Deception
In Singapore, where gazetted hotel occupancy reached 91.2 percent in August 2026 with an ADR of S$284.40, the most critical budgeting lesson lies in the difference between advertised rates and checkout invoices. Singaporean hotel pricing varies dramatically by property scale: small boutique hotels averaged S$148.10, medium-sized hotels S$266.80, and large convention properties S$311.00—a spread of S$162.90 per night between small and large hotels.
However, many hotel booking engines quote base rates before mandatory surcharges, noted as "++" (plus plus). Consider two hotels competing for a reservation:
- Hotel A advertises a room at S$300++ per night.
- Hotel B quotes an all-inclusive rate of S$350 nett per night.
At first glance, Hotel A appears S$50 cheaper. However, Hotel A must add a 10 percent service charge, bringing the taxable rate to S$330. Singapore’s 9 percent Goods and Services Tax (GST) is then calculated on top of both the base rate and the service charge, adding S$29.70. The final invoice for Hotel A totals S$359.70. Consequently, Hotel B's all-inclusive rate of S$350 is actually S$9.70 cheaper per night. Travelers booking multi-night stays in Singapore must always insist on reviewing the final nett quote before confirming reservations.
5. The Maldives: Deciphering the Green Tax and Marine Levies
In the Indian Ocean archipelago of the Maldives, resort demand figures measure individual guest nights rather than rooms, reflecting the reality that resort stays center on couples and families sharing standalone villas. In September 2026, Maldivian resorts recorded 717,240 guest nights, down 2.5 percent from the previous year, yet third-quarter volume as a whole expanded 3.5 percent to 2.78 million nights.
Costing a Maldivian holiday requires navigating mandatory government environmental levies. Under revised tax legislation implemented in January 2025:
- Guests staying at registered tourist resorts, integrated resorts, and resort hotels pay a statutory Green Tax of US$12 per person, per day.
- Guests staying at local guesthouses and hotels on inhabited islands with 50 or fewer registered rooms pay a reduced Green Tax of US$6 per person, per day.
- Children under the age of two are exempt from the tax across all lodging categories.
For a couple spending a seven-night honeymoon at an overwater villa, the Green Tax adds a fixed US$168 to the invoice. If the same couple opts for a boutique dive guesthouse on an inhabited island like Maafushi or Dhigurah, the Green Tax drops to US$84. Additionally, the Maldives applies a 17 percent Tourism Goods and Services Tax (TGST) on all lodging, dining, and seaplane transfers. Because TGST does not apply to the Green Tax itself, travelers can calculate environmental fees in advance while budgeting an additional 17 percent on all other resort expenses.
PRACTICAL TRAVELER ACTION CHECKLIST FOR ASIA LODGING
| Column 1 |
|---|
| 1. REQUEST ITEMIZED RYOKAN BILLS IN KYOTO: Ensure half-board Kaiseki meal costs and consumption |
| taxes are explicitly separated from the room rate to prevent crossing into the ¥10,000 tax band. |
| 2. CALCULATE PER-PERSON LODGING ALLOCATIONS: Remember that Kyoto accommodation taxes apply per |
| head per night; sharing a ¥100,000 suite splits the rate to ¥50,000 per person (Tier 4, not 5). |
| 3. VERIFY ALL-INCLUSIVE NETT RATES IN SINGAPORE: Factor in Singapore's 10% service charge and 9% |
| GST (+19.9% compounded) to avoid being misled by unbundled '++' base prices. |
| 4. ACCOUNT FOR MALDIVES GREEN TAX BY ISLAND TYPE: Budget US$12/person/day for private island |
| resorts versus US$6/person/day for inhabited local island guesthouses, plus 17% TGST. |
| 5. EXPLORE REGIONAL COMMUTER HUBS: During peak autumn and spring foliage seasons in Kyoto, compare |
| rates in Osaka, Otsu (Lake Biwa), or Nara, which offer lower ADRs and direct 25-minute trains. |
Strategic Takeaways for International Travelers
The shifting hotel economics of Kyoto and its Asia-Pacific peers underscore that headline room prices no longer tell the whole story. In an era of escalating municipal tourism levies, rate-driven hotel revenue management, and unbundled service fees, travelers must adopt a more rigorous approach to booking accommodation:
First, always seek total price transparency before entering credit card details. Whether it is Kyoto's tiered accommodation tax, Singapore's compounded service and sales taxes, or the Maldives' environmental levies, mandatory local taxes can easily add 15 to 25 percent to the cost of a multi-night holiday.
Second, recognize that high local room rates do not necessarily signify an overcrowded destination. As Kyoto’s September 2026 data reveals, hotel occupancy dropped below 80 percent and international guest nights fell by 12 percent even as rates climbed. For travelers willing to pay current rates, traveling during these realignment periods often yields a more tranquil, unhurried cultural experience at landmark shrines and temples.
Finally, leverage regional geographic flexibility. In mature railway environments like Japan and Taiwan, basing oneself in a neighboring city can cut accommodation expenses in half without sacrificing access to premier cultural sites. By understanding the underlying economic mechanics that shape room prices, travelers can plan sophisticated, budget-conscious journeys across Asia’s most captivating destinations.
Related Travel Guides
This article is for informational purposes. Flight routes, passenger regulations, visa rules, and transit advisories are subject to change by airlines and aviation authorities. Readers are advised to verify schedules and travel documentation with relevant carriers and border agencies before departure.
Related Stories
Four Seasons Hotel Jakarta Unveils Famiglia Lunch Club at ALTO: Elevating Italian Skyline Dining in the Golden Triangle
Japan Hotel Market Shift 2026: Regional Demand Trends and International Visitor Logistics Guide