Belfast Tops UK Takeaway Food Spending at £70 Monthly as 59% of Britons Cut Back in 2026

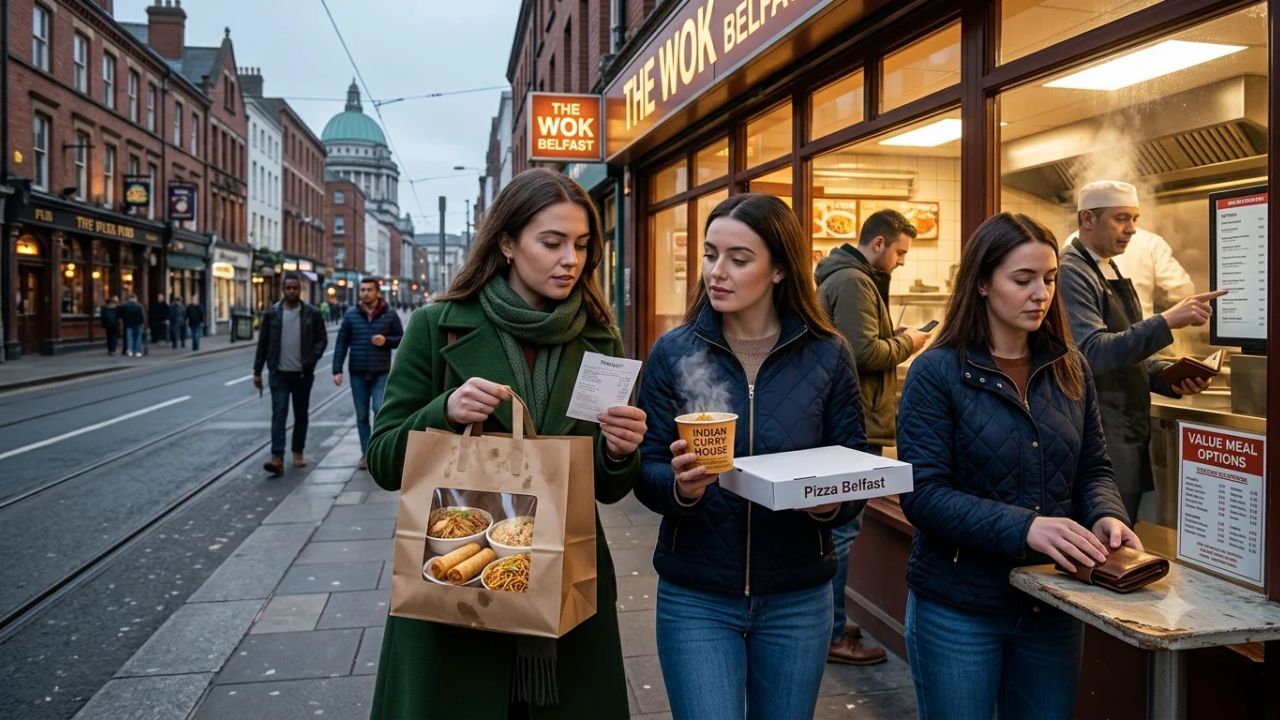
Belfast leads the UK in average monthly takeaway spending at £70.03 per person, outranking Sheffield, Cardiff, and London in 2026
[BELFAST, Oct 30, 2026] — Belfast has emerged as the highest-spending takeaway city in the United Kingdom, with residents allocating an average of £70.03 per month to prepared meals—surpassing local commuting costs and household utility subscriptions—even as 59 percent of British adults report reducing takeaway order frequency across the past two years amid broader cost-of-living pressures.
[!NOTE] Key Empirical Findings and National Spending Benchmarks: A comprehensive national consumer survey of 2,000 UK adults conducted by consumer finance institution Aqua reveals significant regional variations in discretionary dining expenditures. Belfast leads all UK cities with £70.03 in average monthly takeaway spending (£840.36 annualized), closely followed by Sheffield (£68.76 / £825.12 annually), Cardiff (£68.25 / £819.00 annually), and London (£68.13 / £817.56 annually). Across the UK, average adults spend £54 monthly (£648 per year) ordering prepared meals twice a month at an average of £27 per order. While 59 percent of respondents report reducing order frequency over the past 24 months, 39 percent report spending more overall due to menu price inflation. Chinese cuisine remains the nation's favorite takeaway (27 percent), followed by pizza (14 percent) and Indian (14 percent), with Friday night standing as the peak ordering window for 49 percent of British households.
UK TAKEAWAY FOOD ECONOMICS & REGIONAL HIERARCHY (2026)
| Column 1 |
|---|
| [ TOP SPENDING UK CITIES (MONTHLY) ] [ NATIONAL CONSUMER BENCHMARKS ] |
| - 1. Belfast: £70.03 / month (£840.36 / year) - Average UK Monthly Spend: £54.00 |
| - 2. Sheffield: £68.76 / month (£825.12 / year) - Average Annual Spend: £648.00 |
| - 3. Cardiff: £68.25 / month (£819.00 / year) - Order Frequency: 2x per month |
| - 4. London: £68.13 / month (£817.56 / year) - Average Basket Value: £27.00 |
| - 5. Newcastle: £62.75 / month (£753.00 / year) - Friday Night Preference: 49% |
| +----------------------------+---------------------------------------+ |
| v |
| [ COST-OF-LIVING IMPACT & BEHAVIOR ] [ DISH AFFORDABILITY CHAMPIONS ] |
| - 59% of adults ordering less frequently than 2 yrs ago - Chicken Chow Mein: Portsmouth £7.88 |
| - 39% spending more money despite ordering less - Newcastle Chow Mein: £13.64 (+42%) |
| - 26% frequent segment: >=3x monthly (£81/mo / £972/yr) - Margherita Pizza: Liverpool £8.50 |
| - Frequent spend exceeds average commute costs (£67) - Chicken Tikka: Birmingham £9.19 |
| +----------------------------+---------------------------------------+ |
| v |
| [ DISCRETIONARY BUDGET BALANCING STRATEGIES ] |
| - Fixed monthly dining allocations & scheduled treat evenings |
| - Platform comparison: Restaurant direct pickup vs third-party courier apps |
| - Domestic supermarket "fakeaway" alternatives during mid-week intervals |
Belfast Takes the Crown: Dissecting the UK's Leading £70.03 Takeaway Bill
The emergence of Belfast as the highest-spending takeaway city in the United Kingdom highlights a fascinating intersection between cultural dining traditions, urban geography, and household budgetary priorities. According to empirical findings from consumer credit and finance institution Aqua, surveyed adults in Belfast spend an average of £70.03 per person every month on prepared takeaway meals. Over the course of a full calendar year, this consistent monthly expenditure projects to an annual total of £840.36.
The significance of Belfast’s leading position becomes clear when compared against other routine household expenditures reported by residents within the Northern Irish capital. At £70.03 per month, the average takeaway food bill outstrips the £60.24 monthly expenditure dedicated to local commuting, public transit, and vehicle fuel.
Takeaway spending in Belfast also eclipses popular digital entertainment and telecommunications services by a substantial margin. Surveyed residents reported spending an average of £43.77 per month on digital television and music streaming subscriptions, alongside £36.01 on monthly mobile telephone contracts. Consequently, takeaway food expenditure in Belfast sits £9.79 higher than monthly commuting expenses, £26.26 above streaming entertainment, and £34.02 above basic mobile telephone bills.
This pattern demonstrates that prepared food ordered for home consumption represents far more than an incidental luxury; for many Northern Irish households, it has become an established component of monthly discretionary spending. Several localized socio-economic dynamics explain this high expenditure. Belfast possesses a vibrant independent dining culture, where local fish and chip shops, neighborhood Chinese establishments, and artisanal pizza parlors maintain loyal customer bases.
In addition, the cultural phenomenon of the Northern Irish "spice bag" and specialized supper boxes—heavily loaded with shredded salted chilli chicken, chips, peppers, and curry sauce—enjoys immense popularity across residential areas, providing generous multi-person meal combinations that command higher basket totals per order.
BELFAST MONTHLY HOUSEHOLD DISCRETIONARY EXPENSE COMPARISON
| Column 1 |
|---|
| Expense Category Reported Monthly Spend Variance vs Takeaway Bill (£70.03) |
| -------------------------------------------------------------------------------------------- |
| Prepared Takeaway Food £70.03 Baseline (Highest Ranking Category) |
| Public Commute & Travel £60.24 -£9.79 Lower than Takeaways |
| Streaming Subscriptions £43.77 -£26.26 Lower than Takeaways |
| Mobile Phone Contracts £36.01 -£34.02 Lower than Takeaways |
| Projected Annual Takeaway £840.36 Substantial Annual Capital Outflow |
The National Urban Hierarchy: Sheffield, Cardiff, London, and Regional Surprises
The national spending comparison compiled across major British cities reveals that takeaway food expenditure is not strictly dictated by population density or regional living costs. Instead, cities in Yorkshire, Wales, and Northern Ireland outranked the capital city of London in total monthly spend per capita.
Sheffield secured second place nationally, with respondents reporting an average monthly takeaway expenditure of £68.76. The South Yorkshire city trails Belfast by a slim margin of only £1.27 per month, reflecting an estimated annual expenditure of £825.12 per resident. Sheffield’s strong showing reflects its expansive student population across two major universities, combined with a dense network of suburban curry houses, kebab shops, and noodle bars spanning Ecclesall Road and London Road.
Cardiff claimed third position across Britain, with surveyed adults recording an average monthly spend of £68.25. The Welsh capital sits just 51 pence behind Sheffield and £1.78 below Belfast, translating to an annual outlay of £819.00. Cardiff’s position places it ahead of London, Edinburgh, and Newcastle, highlighting how takeaway food has embedded itself into modern Welsh urban life, particularly around busy sports fixtures and weekend social gatherings.
London ranked in fourth position, recording an average monthly takeaway expenditure of £68.13—trailing Cardiff by a modest 12 pence. Over twelve months, this figure equals approximately £817.56 per person. London’s fourth-place ranking illustrates an important economic distinction: individual restaurant menu prices and aggregate monthly spending are distinct metrics.
While dining out or ordering from upscale delivery kitchens in central London districts like Kensington, Soho, or Shoreditch carries some of the highest individual dish prices in Europe, London residents often possess a wider variety of ready-to-eat supermarket meal deals, grab-and-go lunchtime food markets, and rapid grocery delivery apps that provide alternatives to traditional evening restaurant deliveries.
Newcastle rounded out the top five highest-spending cities, with surveyed residents spending an average of £62.75 per month on takeaway food, representing an estimated annual cost of £753.00. Newcastle is followed closely by Edinburgh in sixth place (£61.59 per month / £739.08 annually), Nottingham in seventh (£60.45 per month / £725.40 annually), Bristol in eighth (£58.03 per month / £696.36 annually), Southampton in ninth (£57.21 per month / £686.52 annually), and Birmingham completing the top ten (£56.85 per month / £682.20 annually).
COMPLETE UK TAKEAWAY SPENDING RANKINGS FOR 2026
| Column 1 |
|---|
| Rank City Average Monthly Spend Estimated Annual Spend |
| -------------------------------------------------------------------------------------------- |
| 1 Belfast £70.03 £840.36 |
| 2 Sheffield £68.76 £825.12 |
| 3 Cardiff £68.25 £819.00 |
| 4 London £68.13 £817.56 |
| 5 Newcastle £62.75 £753.00 |
| 6 Edinburgh £61.59 £739.08 |
| 7 Nottingham £60.45 £725.40 |
| 8 Bristol £58.03 £696.36 |
| 9 Southampton £57.21 £686.52 |
| 10 Birmingham £56.85 £682.20 |
The Cost of Living Paradox: 59% Cut Frequency While 39% Spend More
One of the most revealing conclusions emerging from the national survey of 2,000 UK adults is an apparent economic paradox: 59 percent of respondents reported ordering takeaway meals less frequently than they did two years ago due to rising living costs, yet 39 percent reported that their total expenditure on takeaways has actually increased over the identical timeframe.
This dynamic reflects the compounding pressures of food price inflation, elevated commercial energy tariffs, and the restructuring of digital platform fees across the UK hospitality sector. Over the past twenty-four months, commercial kitchens have confronted severe price increases for essential wholesale ingredients, including cooking oils, poultry, dairy, fresh vegetables, and wheat flour. In response to rising input costs and higher commercial utility bills, independent takeaway proprietors and restaurant chains were compelled to adjust menu prices upward simply to maintain solvency.
At the same time, the dominance of third-party digital delivery aggregators has added multiple auxiliary charges to the consumer's final bill. In addition to elevated baseline menu prices, customers ordering through digital platforms now routinely encounter delivery fees ranging from £1.99 to £4.50, administrative service charges of 5 to 10 percent, small-order surcharge fees for baskets below specified minimums, and voluntary driver gratuities.
As a direct consequence of these accumulated costs, a typical weekend takeaway that might have cost a couple £20 to £22 two years ago now frequently exceeds £30 to £35 for identical menu items. Therefore, even though British households are exercising greater discipline by reducing their ordering cadence—perhaps cutting back from once a week to once a fortnight—the elevated ticket price of each individual transaction results in higher aggregate monthly spending for nearly four in ten adults.
THE UK TAKEAWAY INFLATION & BEHAVIORAL PARADOX
| Consumer Metric Surveyed Percentage Economic Mechanism & Driver |
|---|
| -------------------------------------------------------------------------------------------- |
| Reduced Order Cadence 59% of British Adults Discretionary belt-tightening |
| Higher Monthly Outlay 39% of British Adults Menu price inflation & platform fees |
| Primary Cost Pressures Wholesale Food & Energy Commercial kitchen overheads rise |
| Platform Add-on Costs Service & Delivery Charges Auxiliary fees add £5-£8 per basket |
| Behavioral Shift Volume drops, value rises Fewer orders, larger bill totals |
National Consumption Baselines: Frequency, Order Values, and Friday Night Rituals
To understand how individual cities compare against broader British habits, the research established benchmark metrics for the average UK adult. Nationally, British adults spend an average of £54.00 per month on takeaway food, translating to an annual baseline expenditure of £648.00 per person.
This national figure is constructed upon an average purchasing frequency of two takeaway orders per month, with consumers spending approximately £27.00 on each individual order. When measured against this national benchmark of £54.00, Belfast’s average monthly outlay of £70.03 is £16.03 higher than the national standard—representing a 29.7 percent premium over the UK average. Similarly, Sheffield (£68.76) and Cardiff (£68.25) exceed the national benchmark by more than £14 per month.
The research also identified a dedicated segment of high-frequency consumers. More than one-quarter of surveyed British adults—exactly 26 percent—reported ordering takeaway food at least three times per month. For these frequent consumers, purchasing three orders per month at the national average order value of £27.00 results in a monthly outlay of £81.00, totaling £972.00 per year.
This illustrative expenditure of £81.00 per month exceeds the average monthly commuting cost of £67.00 identified across the UK-wide survey sample. This comparison illustrates how regular takeaway purchases can quietly evolve into one of the largest single discretionary line items in a household's annual financial ledger.
In terms of weekly scheduling, the traditional end-of-week takeaway remains firmly entrenched in British domestic life. Friday night dominates as the country's undisputed favorite occasion for ordering prepared food, with 49 percent of surveyed adults identifying Friday evening as their primary time to order.
The enduring appeal of the Friday night takeaway demonstrates that despite intense financial pressures, British consumers continue to view the end of the working week as a well-earned moment of leisure. Gathering around the dining table or sofa with convenient restaurant food collected or delivered to the door serves as an emotional marker transitioning individuals and families from the demands of work to the relaxation of the weekend.
NATIONAL CONSUMPTION & FREQUENCY METRICS (2026)
| Operational Metric National UK Benchmark Comparative Analysis |
|---|
| -------------------------------------------------------------------------------------------- |
| Average Monthly Spend £54.00 per Person Belfast leads by +£16.03 (+29.7%) |
| Average Annual Outlay £648.00 per Person Represents substantial discretionary |
| Order Frequency 2 Orders per Month Standard bi-weekly cadence |
| Average Basket Size £27.00 per Order Multi-item household order |
| Frequent Consumers (>=3x) 26% of Population Spends £81/mo (£972/yr) |
| Frequent vs Commute Spend £81.00 Takeaway vs £67 Commute Takeaway exceeds transit costs |
| Peak Ordering Window Friday Evening (49% of Adults) End-of-week domestic relaxation |
Britain’s Culinary Hierarchy: Chinese, Pizza, and Indian Takeaway Preferences
When British consumers decide to order dinner, their culinary preferences follow an established hierarchy rooted in decades of cultural history. The survey confirmed that Chinese cuisine maintains its reign as the nation's favorite takeaway choice, capturing 27 percent of the national vote.
Pizza and Indian cuisine shared second place, with each category selected by 14 percent of surveyed adults. Together, these three dominant cuisines account for 55 percent of all preferred takeaway orders across the United Kingdom, with the remaining 45 percent distributed among fish and chips, kebabs, burgers, Thai curries, and Mexican street food.
Chinese takeaway’s enduring dominance across Britain stems from its unique flavor profiles, speed of preparation, and generous portion sizes. From sweet and sour chicken balls and crispy aromatic duck to beef in black bean sauce and egg fried rice, Chinese menus offer extensive variety that accommodates family sharing. Many traditional British-Chinese takeaway establishments have operated in neighborhood high streets for generations, cultivating deep community ties.
Pizza holds equal standing alongside Indian cuisine due to its universal appeal across all age demographics. Whether ordered as an affordable mid-week convenience meal for busy working parents or shared among friends during live sporting broadcasts, pizza provides straightforward communal dining.
Indian food maintains a revered position within Britain's culinary identity. Chicken tikka masala, widely recognized as one of the UK’s unofficial national dishes, sits alongside fiery vindaloos, creamy kormas, and fragrant biryanis as a staple of British weekend comfort food. The cultural institution of the neighborhood curry house remains an integral element of high street dining across cities from Glasgow to Southampton.
BRITAIN'S PREFERRED TAKEAWAY CUISINES (2026)
| Column 1 |
|---|
| Cuisine Classification National Preference Share Cultural & Culinary Appeal |
| -------------------------------------------------------------------------------------------- |
| Chinese Cuisine 27% of UK Adults (Rank 1) Fast preparation, variety & sharing |
| Pizza 14% of UK Adults (Joint Rank 2)Communal dining, family convenience |
| Indian Cuisine 14% of UK Adults (Joint Rank 2)Rich spice profiles & curry heritage |
| Other Cuisines (Fish/Chips) 45% Distributed Share Fish & chips, kebabs, burgers, Thai |
Granular Dish Affordability: Mapping Prices Across British Cities
To move beyond broad spending aggregates and examine underlying menu pricing, the research conducted a detailed price-matching analysis across three iconic takeaway dishes: chicken chow mein, margherita pizza, and chicken tikka masala. The results demonstrate that dish affordability varies sharply between different parts of the United Kingdom, revealing that the cheapest city for one cuisine is rarely the cheapest for another.
Chicken Chow Mein: The 42% Regional Price Divide
Portsmouth emerged as the most affordable city in the UK for chicken chow mein, recording an average dish price of £7.88. Stoke-on-Trent followed closely in second place at £8.01, with Coventry ranking third at £8.02. Peterborough placed fourth at £8.08, while Milton Keynes completed the top five at £8.34. Additional cities securing spots in the ten cheapest locations included Swansea (£8.40), Doncaster (£8.44), Aberdeen (£8.52), Derby (£8.54), and Leicester (£8.73).
In sharp contrast, Newcastle recorded the highest average price in Britain for chicken chow mein, with the dish averaging £13.64. When compared against Portsmouth’s leading price of £7.88, Newcastle's average price is 42.2 percent higher, representing a substantial £5.76 difference for the identical style of dish. This remarkable price disparity highlights how localized commercial rents, wholesale supply chains, and competitive restaurant clustering shape menu pricing across different English regions.
TEN CHEAPEST UK CITIES FOR CHICKEN CHOW MEIN (2026)
| Column 1 |
|---|
| Rank City Average Chow Mein Price Variance vs Newcastle (£13.64) |
| -------------------------------------------------------------------------------------------- |
| 1 Portsmouth £7.88 -£5.76 (-42.2% Cheaper) |
| 2 Stoke-on-Trent £8.01 -£5.63 (-41.3% Cheaper) |
| 3 Coventry £8.02 -£5.62 (-41.2% Cheaper) |
| 4 Peterborough £8.08 -£5.56 (-40.8% Cheaper) |
| 5 Milton Keynes £8.34 -£5.30 (-38.9% Cheaper) |
| 6 Swansea £8.40 -£5.24 (-38.4% Cheaper) |
| 7 Doncaster £8.44 -£5.20 (-38.1% Cheaper) |
| 8 Aberdeen £8.52 -£5.12 (-37.5% Cheaper) |
| 9 Derby £8.54 -£5.10 (-37.4% Cheaper) |
| 10 Leicester £8.73 -£4.91 (-36.0% Cheaper) |
Margherita Pizza: Liverpool Leads as Belfast Surprises
In the pizza category, Liverpool claimed the top spot for affordability, offering a standard margherita pizza at an average price of £8.50. Coventry secured second position at £8.78, while Belfast ranked third at £8.84. Salford occupied fourth place at £9.20, and Leeds completed the top five at £9.31.
Belfast’s third-place ranking for margherita pizza provides an illuminating contrast: while Belfast leads the entire UK in overall monthly takeaway spending at £70.03, its pizza prices are among the most affordable in the nation. This demonstrates that high monthly spending in Belfast is driven by consumer ordering frequency and generous basket sizes rather than inherently inflated menu prices.
FIVE CHEAPEST UK CITIES FOR MARGHERITA PIZZA (2026)
| Column 1 |
|---|
| Rank City Average Margherita Price Regional Context & Market Note |
| -------------------------------------------------------------------------------------------- |
| 1 Liverpool £8.50 National Affordability Leader |
| 2 Coventry £8.78 Competitive West Midlands Pricing |
| 3 Belfast £8.84 High overall spend, low pizza price |
| 4 Salford £9.20 Greater Manchester Market Node |
| 5 Leeds £9.31 Strong Yorkshire Value Ranking |
Chicken Tikka Masala: Birmingham’s Curry Heartland Advantage
In the Indian takeaway segment, Birmingham claimed first place for affordability, with chicken tikka masala averaging £9.19. Sunderland followed in second position at £9.74, while Leeds took third place at £10.06. Milton Keynes ranked fourth at £10.37, and Swansea completed the top five at £10.40.
Birmingham’s leading position in curry affordability is directly linked to its world-famous culinary heritage. As the home of the Balti Triangle and a dense, competitive ecosystem of family-owned South Asian restaurants, Birmingham benefits from mature ingredient supply chains and fierce local competition, keeping curry prices accessible even as overall living costs rise.
FIVE CHEAPEST UK CITIES FOR CHICKEN TIKKA MASALA (2026)
| Column 1 |
|---|
| Rank City Average Tikka Masala Price Culinary Heritage Context |
| -------------------------------------------------------------------------------------------- |
| 1 Birmingham £9.19 Balti Triangle competition advantage |
| 2 Sunderland £9.74 North East Regional Value Leader |
| 3 Leeds £10.06 Consistently strong across cuisines |
| 4 Milton Keynes £10.37 Modern Planned Town Value Node |
| 5 Swansea £10.40 Welsh Affordability Benchmark |
Urban Food Delivery Economics: Platform Fees, Service Charges, and Kitchen Realities
The rapid evolution of the UK takeaway landscape over recent years cannot be separated from the digital infrastructure that connects kitchens with dining tables. Digital delivery platforms—such as Deliveroo, Just Eat, and Uber Eats—have transformed how consumers interact with local restaurants, shifting consumer habits from telephone orders and cash-on-delivery to algorithmic marketplaces.
While these digital platforms offer unmatched convenience, real-time courier tracking, and expansive restaurant choice, they impose substantial economic trade-offs for both restaurant operators and consumers. Digital delivery aggregators routinely levy commercial commissions ranging from 15 to 35 percent on every order fulfilled through their platforms. To protect profit margins in an industry characterized by tight operational spreads, hospitality owners frequently mark up their delivery app menus by 15 to 25 percent compared to their in-store collection prices.
For the consumer, these marked-up menu prices are compounded by platform service fees, bag charges, and variable delivery surcharges that fluctuate based on weather conditions and courier availability. An order consisting of two main dishes, a shared side, and drinks that costs £24 when picked up directly from a local takeaway can easily total £34 to £37 when ordered through an app with delivery.
This dynamic explains why 39 percent of British consumers report spending more on takeaway food despite ordering less often. The convenience premium of having hot food delivered directly to the doorstep has grown more expensive, prompting budget-conscious diners to reconsider how they access their favorite meals.
DIGITAL PLATFORM VS DIRECT COLLECTION COST MODEL
| Column 1 |
|---|
| Transaction Element Direct Restaurant Collection Third-Party Delivery App Order |
| -------------------------------------------------------------------------------------------- |
| Baseline Dish Price Standard Menu Pricing (£22.00) App Markup Applied (£26.50) |
| Delivery Fee £0.00 (Self-Collected) £2.50 - £4.50 (Distance Surcharge) |
| Platform Service Fee £0.00 £1.50 - £2.50 (Administrative Fee) |
| Driver Gratuity £0.00 (Optional In-Person) £1.50 - £3.00 (In-App Prompt) |
| Total Order Expenditure £22.00 Total Bill £32.00 - £36.50 Total Bill (+50%) |
Strategic Consumer Tactics: Managing Discretionary Food Budgets in 2026
To help consumers balance their love of takeaway meals with the realities of household financial management, personal finance specialists recommend five practical strategies designed to reduce food expenditure without abandoning cherished dining traditions.
First, establishing a fixed monthly takeaway budget prevents spontaneous spending from accumulating into an unmanageable financial burden. By treating takeaway food as a dedicated envelope within an overall household budget—for example, capping monthly spending at £50 or £60—consumers can enjoy prepared meals with full transparency over their discretionary finances.
Second, scheduling takeaway evenings in advance helps eliminate impulse ordering on busy weeknights. Consumers who plan an end-of-week Friday takeaway are far less likely to order emergency mid-week deliveries when tired after work, reserving takeaway meals as intentional treats rather than default convenience solutions.
Third, taking advantage of restaurant loyalty schemes, voucher codes, and cashback promotions can yield substantial recurring savings. Many independent restaurants and takeaway establishments offer direct ordering apps or loyalty stamp cards that provide 10 to 20 percent discounts on collection orders, bypassing third-party platform commissions entirely.
Fourth, opting for direct collection instead of home delivery represents an immediate way to trim 20 to 35 percent off the final bill. Walking or driving to a local high street to pick up an order eliminates delivery charges, platform service fees, and app-based markups, while ensuring food arrives piping hot straight from the kitchen.
Finally, preparing "fakeaway" meals at home provides an economical and enjoyable alternative during mid-week evenings. Major UK supermarkets have expanded their branded chilled takeaway ranges, offering Indian banquet boxes, Chinese stir-fry meal kits, and stone-baked artisan pizzas at a fraction of restaurant prices. By mastering simple wok cooking, homemade pizza dough, or slow-cooked curry sauces, households can satisfy their takeaway cravings while saving hundreds of pounds each year.
FIVE STRATEGIC CONSUMER BUDGETING TACTICS (2026)
| Column 1 |
|---|
| Tactical Approach Implementation Action Financial & Lifestyle Benefit |
| -------------------------------------------------------------------------------------------- |
| 1. Dedicated Monthly Cap Establish a strict budget envelopePrevents uncontrolled expenditure |
| 2. Scheduled Treat Nights Reserve takeaways for weekends Eliminates expensive impulse orders |
| 3. Loyalty & Direct VouchersOrder directly via restaurant appsBypasses 20-30% aggregator markups |
| 4. In-Person Collection Pick up meals directly Eliminates delivery & service charges |
| 5. Supermarket "Fakeaways" Cook home-style replicas Saves £15-£25 per meal occasion |
Frequently Asked Questions (PAA)
Which UK city spends the most on takeaway food in 2026?
Belfast ranks as the highest-spending takeaway city in the United Kingdom in 2026, with surveyed residents spending an average of £70.03 per person each month on prepared meals. This totals approximately £840.36 per year. Sheffield ranks second with an average monthly spend of £68.76, while Cardiff places third at £68.25 per month.
How much does the average British adult spend on takeaways each year?
The average UK adult spends £54.00 per month on takeaway food, which amounts to £648.00 annually. This national benchmark is based on an average ordering frequency of twice per month, with consumers spending approximately £27.00 per order. However, the top 26 percent of frequent consumers order three or more times per month, spending an average of £81.00 monthly (£972.00 per year).
Why are Britons spending more on takeaways while ordering less often?
While 59 percent of Britons have reduced their takeaway ordering frequency over the past two years to manage living costs, 39 percent report spending more overall due to menu price inflation. Commercial restaurants have had to raise prices to cover higher wholesale food costs and commercial energy bills, while digital delivery platforms have added delivery fees, service surcharges, and minimum basket requirements.
What is the most popular takeaway food in the UK?
Chinese cuisine is Britain's favorite takeaway, selected by 27 percent of surveyed adults as their preferred option. Pizza and Indian cuisine share second place, with each capturing 14 percent of the national vote. Friday night remains the most popular time of the week for ordering takeaway food, with 49 percent of British adults naming it their preferred evening.
Where can you find the cheapest takeaway meals in the UK?
Takeaway affordability varies significantly by dish and city across Britain:
- Portsmouth offers the cheapest chicken chow mein at an average price of £7.88, compared to Newcastle where the same dish averages £13.64.
- Liverpool offers the cheapest standard margherita pizza at an average price of £8.50, followed by Coventry at £8.78 and Belfast at £8.84.
- Birmingham offers the cheapest chicken tikka masala at an average price of £9.19, followed by Sunderland at £9.74 and Leeds at £10.06.
Related Travel Guides
This article is for informational purposes. Flight routes, passenger regulations, visa rules, and transit advisories are subject to change by airlines and aviation authorities. Readers are advised to verify schedules and travel documentation with relevant carriers and border agencies before departure.
Related Stories

Chicago to Bermuda Nonstop 2027: United Airlines Launches Weekly Flights as Island Tourism Evolves

São Paulo BTS Arirang World Tour Guide: MorumBIS Stadium Logistics, MIS Pop-Up, and R$330 Million Tourism Surge