
Asia Aviation Gridlock: 5,189 Delays and 496 Cancellations Paralyze Delhi, Medina, Jakarta, and Middle East Hubs
A compounding wave of severe weather, peatland smoke, and Middle East security restrictions grounds 496 flights and delays 5,189 across Asian aviation hubs.

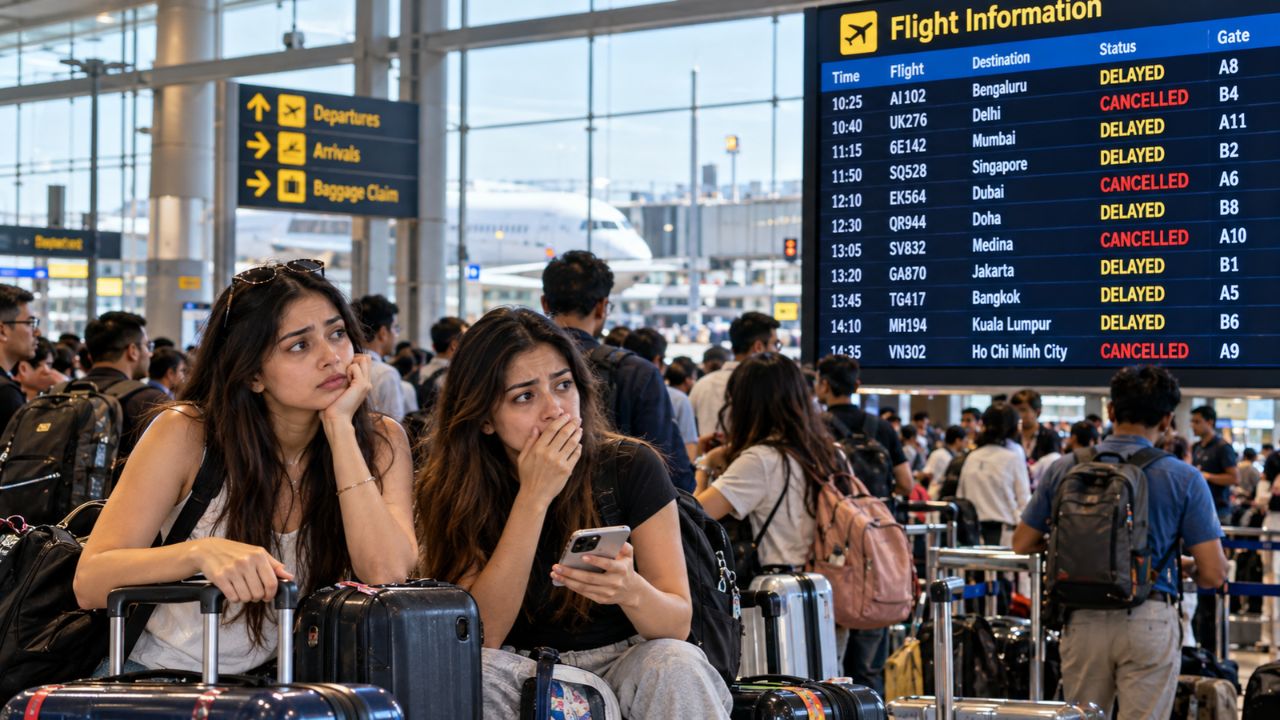
A staggering tally of 5,189 flight delays and 496 outright cancellations immobilized air corridors across Asia and the Middle East within a single operational window, stranding tens of thousands of transit and origin-and-destination passengers. The synchronicity of disruptions—captured in operational data recorded on 15 October 2026 at 3:06 pm ET (16 October 2026 at 12:36 am IST) via FlightAware—stems from an extraordinary convergence of extreme monsoon downpours over the Indian subcontinent, persistent peatland fire haze in Southeast Asia, and escalating airspace restrictions triggered by drone and missile incidents across Saudi Arabia. Rather than isolated irregular operations, the system-wide meltdown reveals acute fragility in cross-continental transit hubs connecting Europe, South Asia, and the Far East.
Compounding Meteorological and Geopolitical Shockwaves
The geographical footprint of the breakdown spans from the Arabian Peninsula through the Indian Ocean rim to mainland China. In India, prolonged late-monsoon precipitation combined with sudden visibility drops overwhelmed surface movement guidance systems at congested metropolitan fields. Delhi’s Indira Gandhi International Airport suffered the heaviest schedule fallout across the continent, recording 648 delayed departures and arrivals alongside eight cancellations. Mumbai’s Chhatrapati Shivaji Maharaj International Airport reported 310 delays and 22 cancellations, while southern tech corridors buckled as Bengaluru logged 146 delays and nine cancellations, and Hyderabad registered 91 delays and four cancellations. Secondary nodes faced proportional strain: Ahmedabad tracked 65 delays and four cancellations, Kochi absorbed 37 delays and six cancellations, Lucknow saw 33 delays and five cancellations, and Navi Mumbai recorded 23 delays and ten cancellations.
In Southeast Asia, ecological degradation collided directly with commercial scheduling. Severe forest and agricultural fire haze in Indonesia reduced runway visual range below standard visual flight limits. Jakarta’s Soekarno-Hatta International Airport registered 286 delays and 32 cancellations, Makassar logged 102 delays and seven cancellations, and Surabaya documented 58 delays and five cancellations. The particulate haze forced air traffic management units to expand separation buffers between arriving airframes, cascading arrival holds into regional transfer banks at Bangkok Suvarnabhumi (279 delays, two cancellations), Kuala Lumpur (225 delays, three cancellations), and Ho Chi Minh City’s Tan Son Nhat (245 delays, eight cancellations).
Simultaneously, the Gulf aviation corridor faced security friction. Drone and missile strikes directed toward Saudi territorial infrastructure prompted localized air defense alerts, temporary flight suspensions, and immediate route diversions under oversight from the General Authority of Civil Aviation (GACA). Jeddah’s King Abdulaziz International Airport bore the brunt of Middle Eastern operational cancellations with 46 flights scrubbed alongside 159 delays. Riyadh’s King Khalid International Airport saw 35 cancellations against just three delays, indicating pre-emptive schedule cancellations to clear terminal gates. Dammam logged 34 cancellations and 41 delays, while Medina’s Prince Mohammad Bin Abdulaziz International Airport posted 31 delays and nine cancellations. UAE transit hubs absorbed diversionary pressure, with Dubai International tracking 178 delays and 13 cancellations, Sharjah logging 54 delays and 14 cancellations, and Doha’s Hamad International handling 125 delays and 16 cancellations.
Regional Flight Disruption and Carrier Reliability Breakdown
Operational stability varied widely among legacy and low-cost operators, reflecting fleet utilization rates and base airport dependencies. Carriers operating tightly turned narrowbody fleets suffered severe schedule unraveling, whereas widebody networks struggled with missed crew duty limits and rotational aircraft positioning.
| Airport or Airline Entity | Flight Delays Recorded | Delay Share (% of Flights) | Flight Cancellations | Cancellation Share (%) | Primary Operational Bottleneck |
|---|---|---|---|---|---|
| Delhi Indira Gandhi (DEL) | 648 | Heavy Hub Impact | 8 | Low Relative Scrub | Severe Rain & Low Surface Visibility |
| Mumbai Shivaji Maharaj (BOM) | 310 | Severe Cross-runway Load | 22 | Elevated Hub Scrub | Monsoonal Inundation & Capacity Caps |
| Jeddah King Abdulaziz (JED) | 159 | Elevated Hub Congestion | 46 | Highest Regional Cancellations | Airspace Safety Buffers & Rerouting |
| Jakarta Soekarno-Hatta (CGK) | 286 | Reduced Approach Capacity | 32 | Severe Runway Pruning | Heavy Agricultural Smoke Haze |
| Bangkok Suvarnabhumi (BKK) | 279 | Arrival Banking Holds | 2 | Minimal Scrub Rate | Downstream Feeder Delays |
| Kuala Lumpur (KUL) | 225 | Holding Pattern Saturation | 3 | Minimal Scrub Rate | Regional Weather & Southeast Asia Holds |
| Ho Chi Minh Tan Son Nhat (SGN) | 245 | Terminal Apron Gridlock | 8 | Moderate Feeder Scrub | Narrowbody Scheduling Bottlenecks |
| Dubai International (DXB) | 178 | Gate & Taxiway Holds | 13 | Moderate Tactical Scrub | Western Asia Airspace Diversions |
| IndiGo Airlines | 723 | 32% | 20 | 0% (Rounded) | High Fleet Rotation Bottlenecks |
| Air India | 216 | 36% | 8 | 1% | Widebody Hub Wave Disruptions |
| SpiceJet | 39 | 59% | 5 | 7% | Fleet Availability & Weather Delays |
| Akasa Air | 53 | 20% | 28 | 11% | Network Slot Compression |
| China Eastern Airlines | 347 | 14% | 6 | 0% (Rounded) | Domestic Hub ATC Sequencing |
| Air China | 154 | 8% | 19 | 1% | Northern Air Corridor Congestion |
| Batik Air (Indonesia) | 84 | 27% | 26 | 8% | Peatland Fire Haze Ground Stops |
| Emirates | 112 | 21% | 5 | 0% (Rounded) | Regional Corridor Re-clearance |
| Qatar Airways | 112 | 18% | 16 | 2% | Gulf Airspace Flow Management |
| Riyadh Air | 0 | 0% | 9 | 32% | Proactive Flight Groundings |
| Shree Airlines (Nepal) | 20 | 35% | 16 | 28% | Mountain Valley Fog & Approach Limits |
In the Himalayan sector, Nepal’s Tribhuvan International Airport in Kathmandu documented 156 delays and 16 cancellations, with domestic regional operator Shree Airlines losing 28 percent of its daily schedule (16 cancellations) and reporting 20 delays affecting 35 percent of its flights. In East Asia, Beijing Capital handled 173 delays and 11 cancellations, Beijing Daxing logged 111 delays and seven cancellations, Guangzhou Baiyun recorded 140 delays and three cancellations, Chengdu Tianfu reported 95 delays and four cancellations, and Kunming Changshui posted 79 delays and seven cancellations.
Expert Analysis: The High-Yield Cabin Geometry Shift
For travelers transiting the Middle East and South Asia, this operational breakdown illustrates how quickly localized disruptions compound across global hub-and-spoke networks. When an airport like Delhi experiences 648 delays, the impact does not remain inside India’s borders. IndiGo’s 723 delayed services (32 percent of its flying schedule) and Air India’s 216 delays (36 percent of its measured flights) mean airframes and operating crews arrive late at outbound long-haul transfer banks, causing passengers to miss connections in Doha, Dubai, and Singapore.
The pricing pressure this dynamic creates is severe. When airlines cancel 496 flights across dense business and pilgrimage routes—such as Jeddah, Riyadh, and Jakarta—available seat inventory evaporates overnight. Displaced passengers requiring re-accommodation absorb remaining seat allocations, driving spot-market one-way economy fares upward by triple digits on short notice.
Legally, passenger rights depend entirely on the operational jurisdiction where the interruption occurs. In India, passengers affected by airline-caused cancellations are entitled to alternate flights or full refunds under the passenger charter established by the Directorate General of Civil Aviation (DGCA). However, when airlines cite meteorological anomalies or government-mandated airspace closures, statutory cash compensation clauses are routinely waived under force majeure exceptions. Similarly, while international carriage remains governed by the liability structures of the Montreal Convention, carriers operating under guidance from the International Air Transport Association (IATA) are mandated to provide basic duty of care—including hotel accommodation and meals—only when delays exceed designated duration thresholds and remain within carrier control.
Key Takeaways
- Scale of Disruption: More than 5,189 flights suffered delays and 496 were cancelled across major Asian and Middle Eastern airports within a single 24-hour cycle.
- Hardest Hit Gateways: Delhi led Asia in total delays with 648 flights held, while Jeddah registered the highest cancellation volume in the Middle East with 46 services cancelled.
- Triple Hazard Trigger: Operational gridlock resulted from the simultaneous impact of intense Indian monsoonal rains, Indonesian forest fire smoke, and Saudi Arabian airspace defense closures.
- Carrier Exposure: SpiceJet saw 59 percent of its operations delayed, while Riyadh Air proactively grounded 32 percent of its flights to manage regional security conditions.
- Legal Protections: Force majeure declarations limit cash statutory compensation, requiring travelers to lean heavily on airline duty-of-care provisions and comprehensive travel insurance policies.
FAQ: Asian Flight Disruptions 2026
What triggered widespread flight cancellations across Asian and Middle Eastern airports?
Disruptions stemmed from simultaneous crises: unseasonal heavy monsoon downpours across India, dense forest fire haze reducing runway visibility in Indonesia, and emergency airspace defense restrictions following military attacks in Saudi Arabia.
Are passengers entitled to cash compensation for weather or security delays?
Airlines generally avoid paying statutory cash compensation by classifying weather phenomena and military airspace closures as extraordinary circumstances beyond carrier control, though duty-of-care meal and lodging requirements still apply.
Which airline experienced the highest percentage of delays during the disruption?
SpiceJet registered the highest proportion of delays among measured carriers, with 59 percent of its scheduled services running behind schedule, followed by Air India at 36 percent.
How can passengers secure rebooking during major regional airport gridlocks?
Travelers should use airline digital mobile applications or direct airport service desks immediately upon notification, as seats fill rapidly due to multi-airport cascading delays.
As climate volatility and geopolitical friction overlap along major aviation arteries, the margin for schedule recovery at mega-hub airports has effectively dropped to zero.
Related Travel Guides
EgyptAir and Ethiopian Airlines Suspend Riyadh and Dammam Flights Over Saudi Airspace Security
Disclaimer
This article is for informational and educational purposes only. It does not constitute legal, financial, or professional advice. While we strive to provide accurate and up-to-date information, travel policies, regulations, and conditions change rapidly. Always verify information with official sources before making travel decisions. Nomad Lawyer makes no representations about the accuracy, reliability, completeness, or suitability of the information provided. Readers should consult qualified professionals for advice specific to their circumstances. The views expressed in this article are those of the author and do not necessarily reflect the views of Nomad Lawyer.
Raushan Kumar
Founder & Lead Developer
Full-stack developer with 11+ years of experience and a passionate traveller. Raushan built Nomad Lawyer from the ground up with a vision to create the best travel and law experience on the web.
Learn more about our team →