
3,265 Flight Delays and 136 Cancellations Disrupt Major US Hubs Including JFK and Seattle in 2026
A surge of 3,265 delays and 136 cancellations across the US aviation network reveals critical vulnerabilities in hub operations during peak demand and weather events.

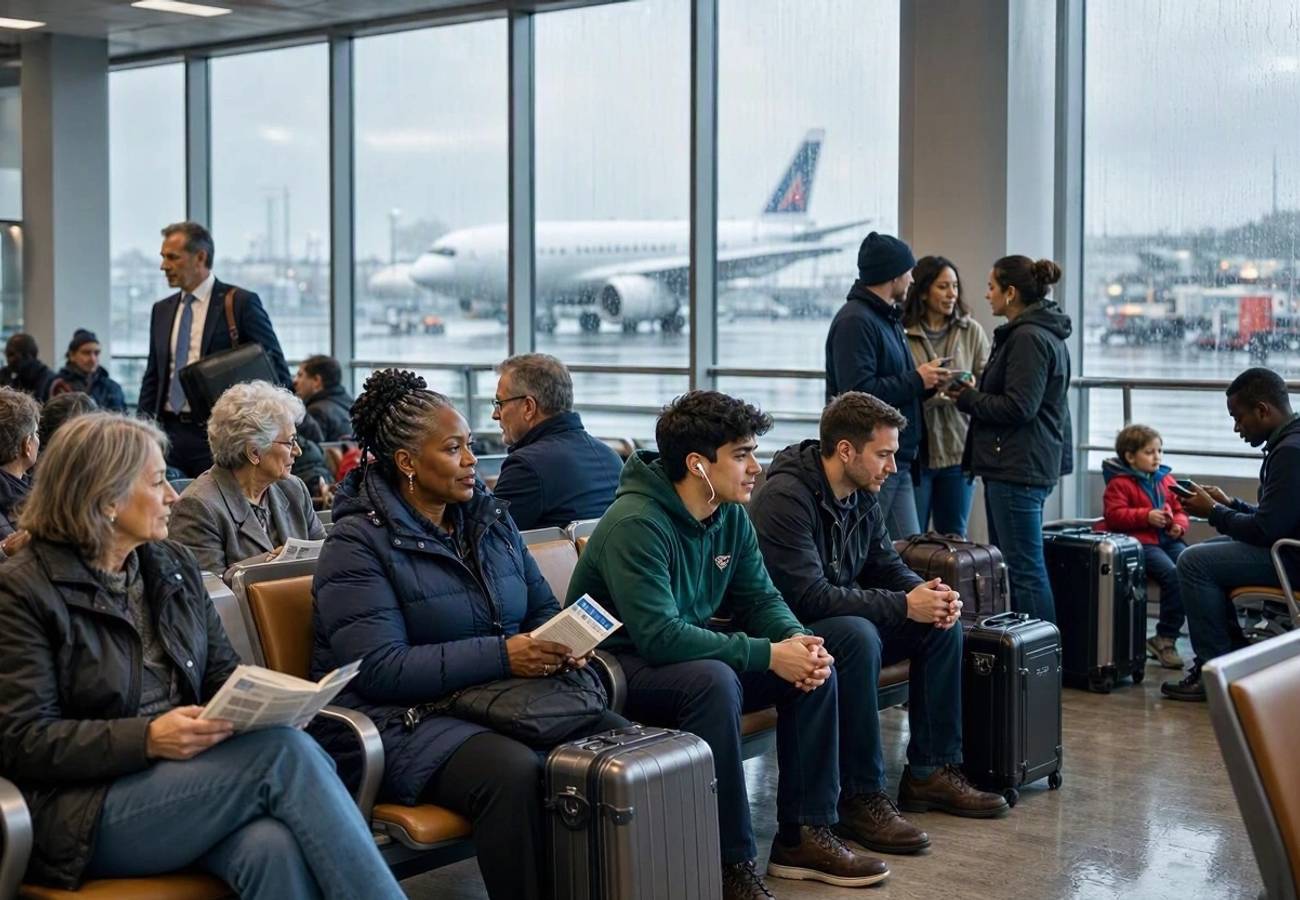
Image generated by AI
3,265 flight delays and 136 cancellations paralyzed segments of the United States aviation network on October 17, 2026, exposing the fragile nature of hub-and-spoke operations. This systemic disruption hit major metropolitan gateways, leaving thousands of passengers stranded or delayed across the East and West Coasts, with the Federal Aviation Administration (FAA) issuing multiple ground stops and departure advisories.
Systemic Failure Across Major US Hubs
The disruption was not localized to a single weather event but was a confluence of infrastructure limitations and atmospheric volatility. In the Northeast, wind-related ground stops forced a standstill at John F. Kennedy (JFK) and LaGuardia, while Newark Liberty struggled with turbulence and weather patterns associated with the ZDC (Washington Center) airspace.
On the West Coast, the crisis was compounded by operational bottlenecks. Seattle-Tacoma International suffered from runway construction, while San Diego International faced "compacted demand," a technical term indicating that aircraft arrivals exceeded the airport's hourly capacity to process them.
Operational Breakdown: Airport and Airline Data
The following data represents the scale of the disruption captured on October 17, 2026, at 3:33 pm ET.
Airport Disruption Metrics
| Airport | Delays | Cancellations | Departure Delay Rate | Arrival Delay Rate | Primary Cause |
|---|---|---|---|---|---|
| San Diego Intl | 224 | 14 | 30% | 33% | Compacted Demand |
| Boston Logan Intl | 192 | 10 | 14% | 16% | General Disruption |
| Newark Liberty Intl | 179 | 7 | 7% | 22% | Weather/Turbulence |
| Los Angeles Intl | 168 | 17 | 11% | 9% | General Disruption |
| JFK Intl | 163 | 5 | N/A | N/A | Wind Ground Stop |
| Philadelphia Intl | 150 | 10 | 13% | 14% | General Disruption |
| Reagan National | 125 | 20 | 20% | 13% | High Cancellation Volume |
| San Francisco Intl | 115 | 12 | 8% | 10% | General Disruption |
| LaGuardia | 115 | 8 | 15% | 13% | Wind Ground Stop |
| Baltimore/Wash Intl | 98 | 6 | 18% | 15% | General Disruption |
| Seattle-Tacoma Intl | 91 | 3 | N/A | N/A | Runway Construction |
| Luis Muñoz Marín Intl | 57 | 22 | 10% | 13% | High Cancellation Volume |
Airline Performance Impact
| Airline | Total Delays | Total Cancellations | Delay Rate | Cancellation Rate |
|---|---|---|---|---|
| American Airlines | 759 | 9 | 21% | N/A |
| Southwest Airlines | 562 | 13 | 16% | N/A |
| United Airlines | 257 | 45 | 8% | 1% |
| PSA Airlines (AAL) | 130 | 23 | 17% | 3% |
| JetBlue Airways | 152 | 8 | 17% | N/A |
Expert Analysis: The Cost of Hub Congestion
For travelers booking flights through these specific hubs, the direct consequence of this data is a heightened risk of "cascading delays." When a carrier like American Airlines—which saw the highest delay volume at 759 flights—experiences a disruption at a hub like Dallas or Charlotte, the effect ripples across the entire network.
The data reveals a telling disparity between delays and cancellations. United Airlines, while having a lower delay rate (8%), suffered the highest number of cancellations (45). This suggests a strategic operational decision to "cut" flights entirely to prevent further schedule erosion, rather than attempting to recover delayed aircraft.
The pricing pressure created by such volatility often leads to "last-minute surge pricing" on alternative routes. When Reagan National recorded the highest cancellation count among mainland US airports (20), passengers attempting to rebook via FlightAware or airline apps likely faced limited seat availability and inflated fares for the remaining capacity.
Furthermore, the "compacted demand" seen in San Diego (30% departure delay rate) indicates that the US aviation infrastructure is operating at a ceiling where even a minor inefficiency triggers a total system slowdown.
Key Takeaways
- Carrier Volatility: American Airlines faced the most significant operational strain with 759 delays, while United Airlines opted for more aggressive cancellations (45).
- Infrastructure Bottlenecks: Runway construction in Seattle and demand saturation in San Diego acted as primary catalysts for regional delays.
- Regional Hotspots: Reagan National and Luis Muñoz Marín Intl emerged as the most unstable airports in terms of flight cancellations.
- Passenger Rights: Travelers facing these disruptions should prioritize official app notifications and verify refund eligibility before accepting alternative itineraries.
FAQ: US Flight Disruptions 2026
What should I do if my flight is cancelled at a major hub? Immediately use the airline's mobile app to rebook. If the app is unresponsive, proceed to the customer service desk. Ensure you document the cancellation for potential insurance claims or refund requests.
Are these delays covered by airline compensation? Compensation depends on the cause. Weather-related ground stops (like those at JFK/LaGuardia) are often considered "force majeure," but delays caused by runway construction or "compacted demand" may offer more leverage for passenger claims.
How can I avoid these delays in the future? Monitor International Air Transport Association (IATA) updates on global aviation standards and check FAA advisories 24 hours before departure. Avoid tight connections at high-volume hubs like Newark or LAX during peak seasons.
The thin line between a functioning schedule and total aviation gridlock is often just a few knots of wind or a single closed runway.
Related Travel Guides
Disclaimer
This article is for informational and educational purposes only. It does not constitute legal, financial, or professional advice. While we strive to provide accurate and up-to-date information, travel policies, regulations, and conditions change rapidly. Always verify information with official sources before making travel decisions. Nomad Lawyer makes no representations about the accuracy, reliability, completeness, or suitability of the information provided. Readers should consult qualified professionals for advice specific to their circumstances. The views expressed in this article are those of the author and do not necessarily reflect the views of Nomad Lawyer.
Naina Thakur
Contributor & Travel Specialist
Travel enthusiast and legal writer covering visa regulations, responsible tourism, and cultural journeys across global destinations.
Learn more about our team →