
US-China Aviation Tensions Put New York Tourism Recovery in Spotlight as High-Value Chinese Travel Lags
As US and Chinese trade officials meet in New York, sluggish transpacific flight restoration leaves a $12 billion spending shortfall across American tourism and hotels.

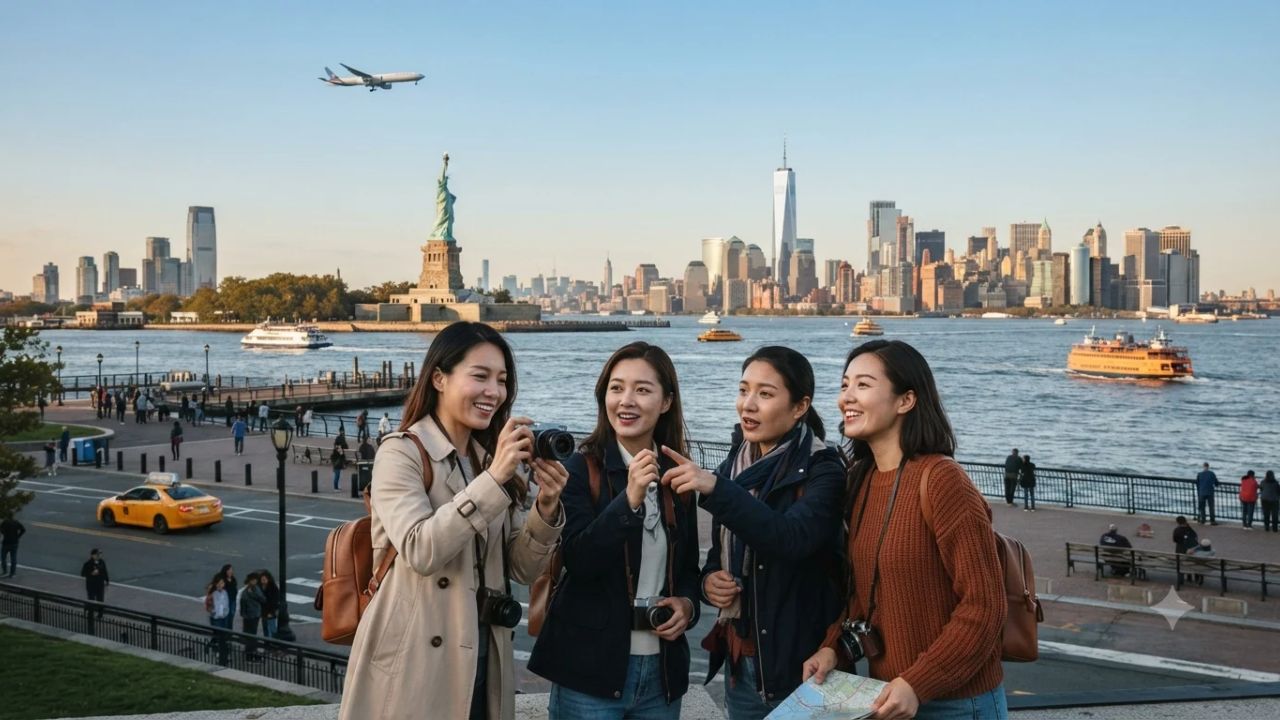
Image generated by AI
A lingering 42 percent volume deficit and an annual spending shortfall exceeding $12 billion continue to suppress Chinese inbound travel to the United States compared to historical highs. When United States Trade Representative Jamieson Greer and Treasury Secretary Scott Bessent sit down in New York on September 20, 2026, for inaugural in-person economic talks with Chinese Vice Premier He Lifeng, the formal agenda will prioritize trade commitments, non-sensitive goods, and market access ahead of higher-level bilateral meetings in Washington DC. Yet beneath the trade negotiations lies an acute commercial reality for host city New York: the unresolved bottleneck of transpacific passenger aviation, governed by reciprocal flight restrictions overseen by the Office of the United States Trade Representative (USTR) and transport regulators, continues to starve American urban hospitality of its highest-spending international visitor demographic.
Air Service Bottlenecks: How Reciprocal Flight Quotas Restrain Transpacific Volume
The arithmetic of transpacific travel demonstrates why commercial aviation remains the primary gatekeeper of destination recovery. Between 2015 and 2019, mainland China stood as the undisputed leader in generating travel export revenue for the United States, accounting for 13.6 percent of all international travel export dollars. In 2019 alone, approximately 2.8 million Chinese citizens entered the United States, injecting $33.3 billion into hotels, airlines, cultural institutions, and retail corridors.
When emergency border closures shuttered international passenger corridors in early 2020, bilateral seat capacity collapsed. Transpacific frequencies were subsequently placed under strict administrative oversight by the US Department of Transportation (DOT) and the Civil Aviation Administration of China (CAAC). Rather than opening schedules to unfettered market demand, both governments instituted a tightly managed regime of reciprocal flight approvals. In 2021, Chinese visitation to the United States bottomed out at 192,000 arrivals—a historic 93 percent decline from 2019. Modest improvements followed, with arrivals reaching 368,000 in 2022 and climbing to nearly 1.1 million in 2023.
| Benchmark Indicator | Historical 2019 Peak | 2021 Contraction | 2023 Intermediate Level | NTTO 2026 Forecast | NTTO 2030 Projection |
|---|---|---|---|---|---|
| Annual Chinese Visitor Volume | 2.8 million | 192,000 | 1.1 million | 1.617 million | 2.245 million |
| Market Recovery vs. 2019 | 100% | 7.0% | 38.0% | 57.8% | 80.2% |
| Aggregate US Travel Spending | $33.3 billion | Depressed | $21.0 billion | Progressive Rebound | Long-Term Expansion |
| Average Duration of Stay | 31 days | Unreported | 35 days | 33–36 days | Multi-week standard |
| Share of US Travel Exports | 13.6% | Residual | 14.0% (bilateral exports) | High-Value Tier | Key Growth Contributor |
Despite reaching nearly 1.1 million visitors in 2023, arrivals represented barely 38 percent of 2019 volume. However, spending dynamics proved remarkably resilient. Those 1.1 million visitors generated nearly $21 billion across the American economy, accounting for 14 percent of total US exports to China. Commerce Department surveys revealed that Chinese visitors recorded an average stay of 35 days in 2023, with more than half of all travelers staying longer than two weeks. This disproportionate dwell time multiplies ground spending across lodging, regional transportation, dining, and retail sectors.
Federal forecasts from the National Travel and Tourism Office (NTTO) confirm that transpacific recovery will follow an extended multi-year trajectory. After registering 1.562 million arrivals in 2025, Chinese inbound travel is projected to expand by just 3.5 percent in 2026 to 1.617 million. Annual acceleration will gain momentum later, with projections of 1.778 million in 2027 (+9.9 percent), 1.935 million in 2028 (+8.9 percent), 2.091 million in 2029 (+8.0 percent), and 2.245 million by 2030 (+7.4 percent). Even with consecutive years of steady gains, the 2030 projection remains roughly 555,000 arrivals below the 2019 benchmark, emphasizing the enduring structural constraints surrounding bilateral travel.
Gateway Exposure: New York City Hospitality Confronts the High-Yield Deficit
New York City’s position as the stage for the September 20 diplomatic talks underscores its direct exposure to transpacific travel flows. Data from the NTTO confirmed that New York ranked as the single most-visited US state by overseas travelers in 2023, while New York City maintained its standing as the nation's premier urban destination for foreign arrivals.
Historical geographic distribution shows that 34 percent of all Chinese travelers visiting the United States in 2022 included New York in their itineraries, making the Empire State the second-largest beneficiary behind California. By 2024, destination marketing agency New York City Tourism + Conventions projected 833,000 Chinese visitors to the five boroughs, more than double the volume recorded the prior year.
The city's wider visitor economy enters late 2026 with strong baseline fundamentals, even as long-haul international segments rebuild gradually:
- Total Visitation (2025 Actual): 65.1 million visitors, generating $84.7 billion in overall economic impact and supporting over 388,000 leisure and hospitality positions.
- Accommodations Performance (2025 Actual): 38.1 million room nights sold across roughly 124,000 hotel rooms, reflecting a 2 percent increase over 2024, while average daily room rates rose 5 percent to $334.
- Forward Pipeline (Through 2028): 24 hotel construction projects actively underway, slated to deliver 5,778 additional rooms into commercial inventory.
- Municipal Projections (2026 Targets): 66.3 million total travelers, comprising 12.9 million international arrivals and 12.8 million business travel journeys.
The economic importance of Chinese tourists to New York hotels and cultural venues is magnified by length of stay. While domestic weekend travelers typically occupy hotel rooms for two nights, international Chinese visitors averaging 35 days across the United States spend considerable time in gateway cities. Their presence sustains Broadway theaters, museums, retail districts, and dining venues from lower Manhattan to Flushing, Queens. When the 14th US-China Tourism Leadership Summit convened in Xi'an in May 2024, federal trade officials estimated that returning Chinese visitation to 2019 levels would generate more than 50,000 direct American jobs and support up to 400,000 positions nationwide when factoring in supply chains and university enrollment.
Expert Analysis: The Structural Economics of Transpacific Route Rationing
For travelers booking transpacific routes between North America and mainland China, the direct consequence of bilateral regulatory inertia is elevated baseline airfares and prolonged transit itineraries. Before 2020, dozens of daily non-stop widebody flights connected New York John F. Kennedy (JFK) and Newark Liberty (EWR) directly with Beijing Capital (PEK), Shanghai Pudong (PVG), and Guangzhou Baiyun (CAN). In 2026, the volume of non-stop city pairs remains a fraction of pre-pandemic schedules.
The pricing pressure this creates means transpacific economy fares frequently command double their pre-2020 averages, while premium business class cabins command substantial pricing power due to constrained seat inventory. American carriers—operating under airspace restrictions that prevent overflight of Russian sovereign territory—face route detours of up to two hours on East Coast transpacific departures. This operational reality increases fuel burn and flight crew costs compared to Chinese state carriers, which continue to operate shorter polar and Siberian routing corridors. To prevent competitive imbalance, regulatory authorities have maintained equalized frequency caps rather than authorizing unilateral capacity increases.
As a result, high-yield travelers are systematically diverted through third-country sixth-freedom hubs. Connecting itineraries via Seoul Incheon (ICN), Tokyo Haneda (HND), and Taipei Taoyuan (TPE) capture substantial passenger traffic that once flew direct into JFK and EWR. While these indirect routings provide necessary seat capacity, they add six to ten hours to total travel time and dilute direct passenger spending within the primary American arrival gateways.
Additionally, travelers must understand that economic talks between trade representatives and finance ministers do not automatically rewrite airline operating certificates. While Greer, Bessent, and He Lifeng address tariff schedules and investment rules in Manhattan, bilateral flight quotas remain subject to separate technical negotiations between the Department of Transportation and aviation ministries. Until reciprocal air access agreements are formally expanded, passenger volumes will remain governed by artificial capacity ceilings, leaving gateway destinations like New York to extract higher value from a smaller pool of visitors.
Key Takeaways
- Diplomatic Gathering: High-level economic talks between US Trade Representative Jamieson Greer, Treasury Secretary Scott Bessent, and Chinese Vice Premier He Lifeng open in New York on September 20, 2026, ahead of Washington summit sessions.
- Unresolved Air Connectivity: Passenger air services remain capped under strict reciprocal bilateral frameworks, keeping total weekly non-stop flights between the two countries far below pre-pandemic levels.
- Protracted Arrival Timeline: Official NTTO forecasts project 1.617 million Chinese arrivals in 2026, rising gradually to 2.245 million by 2030—still below the 2.8 million visitors recorded in 2019.
- High-Yield Spending Profile: Despite lower volumes, Chinese travelers generated nearly $21 billion in US spending in 2023, supported by an extended 35-day average length of stay.
- New York Tourism Exposure: With 34 percent of Chinese visitors historically traveling to New York and hotel rates averaging $334 per night, the slower inbound rebound leaves billions in potential city hospitality spending unrealized.
FAQ: US-China Aviation and New York Tourism Recovery 2026
Will the September 20 economic meetings immediately increase US-China flights?
No. The Manhattan meetings focus strictly on bilateral trade, commercial commitments, and market access. Any expansion of commercial passenger flight rights requires formal regulatory approval through technical negotiations between the US Department of Transportation and Chinese civil aviation authorities.
How many Chinese tourists are projected to visit the United States in 2026?
The National Travel and Tourism Office projects approximately 1.617 million Chinese arrivals in 2026, representing a modest 3.5 percent increase over 2025 actual figures, with stronger annual percentage growth anticipated between 2027 and 2030.
Why are transpacific flights between the US and China taking longer to recover?
Recovery remains constrained by reciprocal flight quota systems, geopolitical tensions, and operational disparities, including Russian airspace avoidance by American carriers that extends East Coast flight times and inflates operating costs.
What is the economic impact of Chinese travelers on New York City?
Chinese visitors average 35 days in the US, with roughly one-third visiting New York. Their high spending across lodging, dining, Broadway theaters, and luxury retail supports over 388,000 hospitality positions across the five boroughs.
[Until bilateral aviation policy unshackles transpacific flight schedules, gateway cities like New York will continue chasing the high-value spending of a market still operating at half its potential.]
Related Travel Guides
Cathay Pacific Celebrates Skytrax Success With World’s Best Cabin Crew and Lounge Recognition
Japan Airlines Sets New Green Aviation Milestone With CORSIA Carbon Removal Partnership
10 Best Airline Lounges at JFK Airport: Complete Terminal Guide 2026
Disclaimer
This article is for informational and educational purposes only. It does not constitute legal, financial, or professional advice. While we strive to provide accurate and up-to-date information, travel policies, regulations, and conditions change rapidly. Always verify information with official sources before making travel decisions. Nomad Lawyer makes no representations about the accuracy, reliability, completeness, or suitability of the information provided. Readers should consult qualified professionals for advice specific to their circumstances. The views expressed in this article are those of the author and do not necessarily reflect the views of Nomad Lawyer.
Raushan Kumar
Founder & Lead Developer
Full-stack developer with 11+ years of experience and a passionate traveller. Raushan built Nomad Lawyer from the ground up with a vision to create the best travel and law experience on the web.
Learn more about our team →