
Texas Aviation Passenger Numbers Break All-Time Records in H1 2026
Texas airports processed record passenger volumes in early 2026, driven by Austin's tech boom and Houston's World Cup sports tourism.
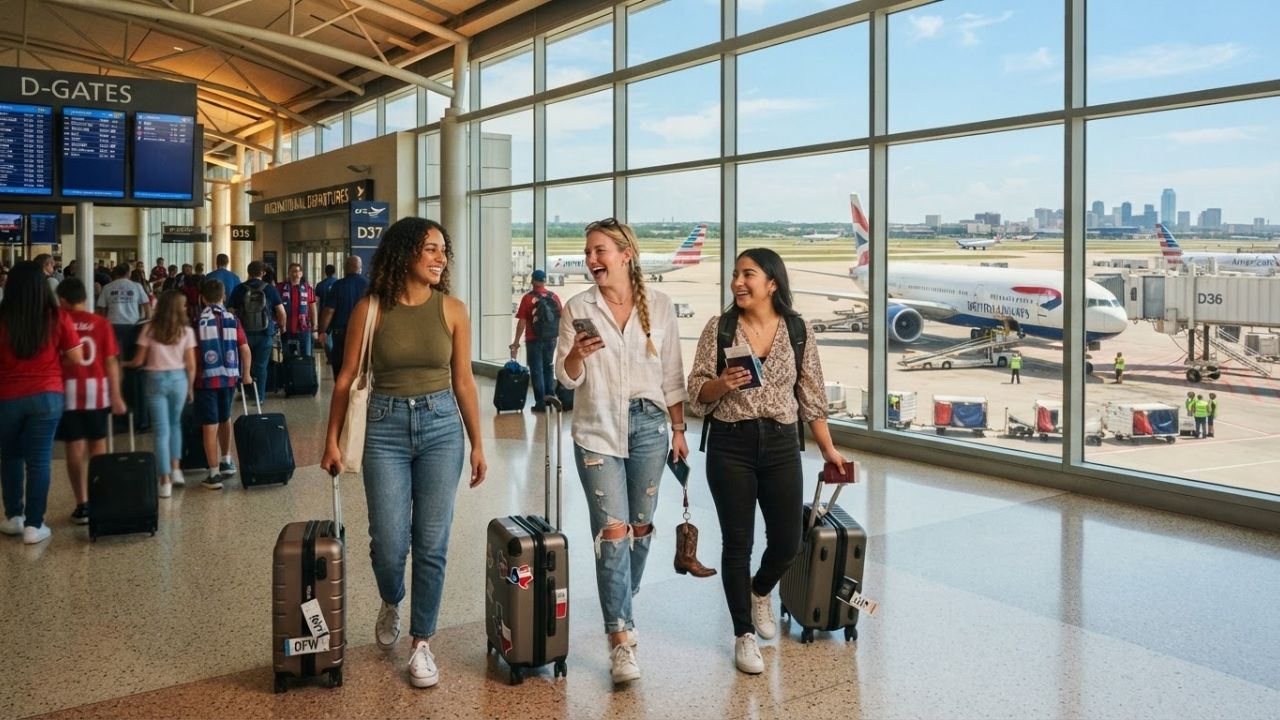
Image generated by AI
Driven by international sports tourism surrounding the FIFA World Cup in Houston and a technology sector boom in Austin, Texas airports processed record passenger volumes during the first seven months of 2026.
The Core Transit Update
Commercial aviation corridors and airport passenger throughput rates are reaching historic highs across Texas. From January through July 2026, Dallas/Fort Worth International (DFW) processed between 48 million and 50 million total passengers, while Dallas Love Field (DAL) handled up to 9.8 million.
In Houston, the dual-airport system welcomed 4.5 million travelers during the 25-day World Cup window (June 12 to July 3), and Austin-Bergstrom International (AUS) set an all-time monthly record in June with 2,102,853 passengers. Concurrently, San Antonio International (SAT) expanded its international seat capacity by 84% compared to 2019 baselines.
Airport Hub Metrics & Capacity Gains
Managing high-density passenger flows during peak travel seasons requires comparing regional hub traffic alongside carrier allocations. The following tables outline Texas airport throughput and specific airline capacity growth.
| Airport Hub | IATA Code | YTD Throughput (Jan – Jul 2026) | Est. Average Load Factor (PLF) | Primary Carrier Share |
|---|---|---|---|---|
| Dallas/Fort Worth | DFW | ~48M – 50M passengers | 83.7% | American Airlines (~85%) |
| Houston Intercontinental | IAH | ~28M – 30M passengers | 84.2% | United Airlines (~70%) |
| Austin-Bergstrom | AUS | ~12.8M passengers | 82.8% | Southwest (~41%), Delta (~19%) |
| Dallas Love Field | DAL | ~9.8M passengers | 82.0% | Southwest Airlines (~94%) |
| Houston Hobby | HOU | ~8.2M passengers | 81.9% | Southwest Airlines (~92%) |
| San Antonio | SAT | ~6.1M passengers | 81.2% | Southwest (~36%), American (~22%) |
Primary Texas aviation hub operational metrics.
| Texas Airport / Terminal | Selected Carrier | Year-on-Year Growth Metric | Strategic Operational Detail |
|---|---|---|---|
| Austin-Bergstrom (AUS) | Delta Air Lines | +18.0% passenger throughput | Processed 1.62 million passengers |
| Austin-Bergstrom (AUS) | JetBlue | +156.0% passenger throughput | High-yield point-to-point tech corridor |
| San Antonio (SAT) | International routes | +84.0% capacity (vs 2019) | Toronto direct flights & Mexican hubs |
| Dallas/Fort Worth (DFW) | American Airlines | +3.02% Available Seat Miles | Third busiest global airport by movements |
Texas aviation capacity expansions and carrier metrics.
Traveler Logistics Guide
From a ground-level perspective, the best way to navigate this is to enroll in TSA PreCheck or CLEAR and download your airline's mobile app before arriving at the terminal, as average passenger load factors exceeding 83% across all hubs mean check-in desks and security checkpoints face peak delays. Checking flight gate status is recommended.
To plan your transit across Texas airports:
- Austin-Bergstrom Point-to-Point: Over 85% of AUS passengers are local origin/destination travelers rather than transit transfers. Allow an extra 30 minutes for rental car return and rideshare pickups.
- Houston World Cup Transit: George Bush Intercontinental (IAH) serves as a primary international gateway. Ensure you have a valid ESTA or US visa ready, as international arrivals processed by CBP grew by 2%.
- Love Field Gate Constraints: Due to the Wright Amendment gate caps, Southwest flights at DAL are highly optimized. Check gate boards for last-minute modifications.
- San Antonio Feeder Route: If flying the SAT-DFW feeder route (152,000 seats in Q3), ensure your connection window at DFW is at least 1.5 hours to navigate terminal changes.
Infrastructure Impact Assessment
To accommodate this unprecedented passenger volume, Texas airports are executing over $4 billion in capital development programs.
By constructing Terminal F at DFW, transforming Terminal B at IAH, and building a new 20-gate concourse at AUS, airport authorities eliminate bottlenecks and expand high-margin belly cargo capacity (which reached 112 million pounds in Austin through May), securing long-term economic returns for regional transit networks.
Related Travel Guides
Turkey Boosts Heritage Tourism at Hattusha UNESCO Archaeological Site
Disclaimer
This article is for informational and educational purposes only. It does not constitute legal, financial, or professional advice. While we strive to provide accurate and up-to-date information, travel policies, regulations, and conditions change rapidly. Always verify information with official sources before making travel decisions. Nomad Lawyer makes no representations about the accuracy, reliability, completeness, or suitability of the information provided. Readers should consult qualified professionals for advice specific to their circumstances. The views expressed in this article are those of the author and do not necessarily reflect the views of Nomad Lawyer.