Travel Chaos Peaks as JFK and Newark Named America's Most Stressful Airports Amid Rising Flight Cancellations and Disruptions: Latest Airline News
As chronic travel chaos and sudden flight cancellations surge across the US network, a new study officially names JFK and Newark as America's absolute most stressful aviation hubs.
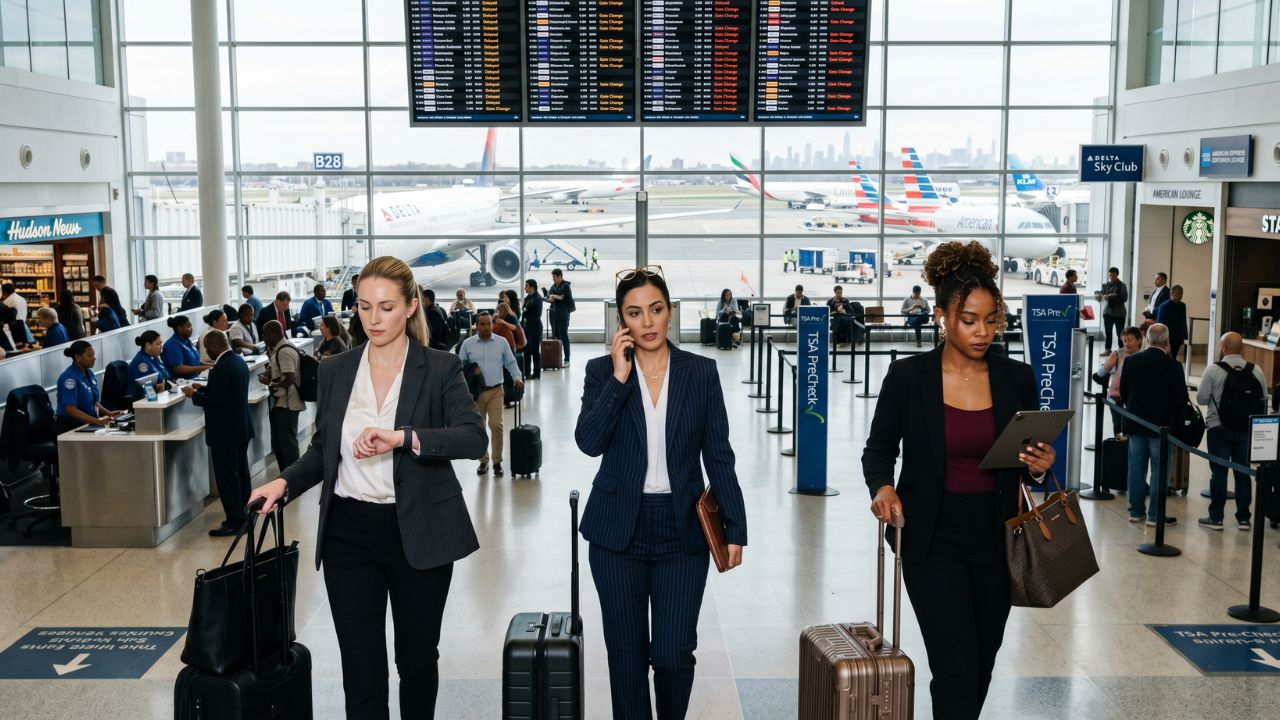
Image generated by AI
A highly comprehensive new industry study has officially confirmed what exhausted corporate commuters have feared for years: New York’s primary aviation gateways are the absolute epicenters of systemic travel chaos. Conducted by Booking.com for Business and released on June 19, 2026, the data definitively ranks John F. Kennedy International Airport (JFK) as the most stressful aviation hub for business travelers in the United States. Evaluating critical friction points including rolling airport disruptions, prolonged customs wait times, and grueling ground commutes, analysts awarded JFK a staggering stress score of 8.06 out of 10. Closely mirroring this operational collapse is Newark Liberty International Airport, which secured second place by generating the nation’s highest rate of flight cancellations and delays. As the American aviation network struggles under historic passenger volumes, the agonizing combination of runway congestion and highway gridlock at these massive hubs is driving today's most crucial headline in breaking airline news and essential global aviation updates.
By introducing direct passenger coordination and dynamic scheduling backups, the regional aviation hubs target growing passenger demand across vital commerce sectors. The choice to coordinate flight departures in phases helps to manage gate capacity, supporting the country's broader regional transportation network.
Context: The Reality of East Coast Gridlock
For the domestic aviation industry, this landmark study provides quantifiable proof that massive international gateways frequently fail to deliver the operational efficiency required by modern corporate travelers.
Historically, the New York metropolitan area has always been a highly challenging airspace to navigate. However, the current levels of systemic travel chaos are severely compromising professional productivity. The study highlights that navigating JFK introduces an array of unpredictable variables that frequently derail time-sensitive business itineraries. Because the corporate travel ecosystem demands absolute predictability, the sheer physical scale of the airport creates logistical friction as commuters struggle to transition efficiently between disjointed terminal buildings. When these terminal delays are combined with unpredictable flight scheduling, the location becomes an absolute pressure cooker for professionals attempting to execute high-stakes corporate mergers and international trade summits. Industry analysts note that compounding terminal delays at JFK and Newark currently drain millions of pounds in billable corporate hours annually, forcing travelers to battle bureaucratic bottlenecks rather than preparing core presentations.
To view live flight schedules, verify the active delay status of your specific New York itinerary, or to track active airspace restrictions across the East Coast, travelers must consult official aviation directories. For direct updates regarding how this massive travel chaos affects specific route abandonments and current flight cancellations, travelers should aggressively utilize the official portals of major carriers operating out of JFK and Newark. To explore live flight tracking and monitor the exact severity of the cascading bottlenecks at competitor US hubs, passengers can consult the official FlightAware tracking service.
Section-Wise Breakdown: America's Most Stressful Hubs
John F. Kennedy International Airport (JFK)
Securing the infamous crown as America’s most stressful hub, JFK scored an 8.06 out of 10. The primary drivers of this travel chaos are extreme delays during both terminal processing and ground transport. Arriving international executives face an exhausting average customs wait time of 24 minutes and 48 seconds. Furthermore, traveling from the passenger terminals into the beating heart of Manhattan takes an astonishing average of 65 minutes under standard conditions.
Newark Liberty International Airport
Securing a notorious second-place finish, Newark Liberty International scored an incredibly high 7.99 out of 10 on the definitive stress metric. Newark actually surpassed its New York rival in terms of pure scheduling volatility, suffering a staggering 30 per cent flight disruption rate. This massive volume of flight cancellations and severe delays makes it one of the least dependable major departure points in the country.
The Tied Third-Place Finishers
The stress is not entirely contained to the East Coast. California’s Ontario International Airport and Florida’s Fort Lauderdale-Hollywood International Airport tied for a highly frustrating third place. Both of these regional alternatives suffered immensely from localized airspace crowding and severe commuter traffic congestion on surrounding arterial motorways, proving that secondary airports are also susceptible to massive travel chaos.
Technical Roster: US Airport Stress Disruption Data
To ensure absolute factual accuracy regarding the exact statistical parameters of this systemic friction and the specific scores driving these airport disruptions, the following matrix details the verified Booking.com for Business data:
US Airport Stress & Disruption Index Matrix
| Airport | Stress Score (out of 10) | Disruption Metrics |
|---|---|---|
| JFK International (NY) | 8.06 | 24m 48s Customs Wait, 65m City Transit |
| Newark Liberty (NJ) | 7.99 | 30% Flight Disruption Rate |
| Ontario Int’l (CA) | Tied 3rd | Severe Local Traffic/Airspace Crowding |
| Fort Lauderdale (FL) | Tied 3rd | Severe Local Traffic/Airspace Crowding |
| Phoenix Sky Harbor (AZ) | Least Stressful | Exceptional 20.5% Flight Disruption Rate |
Data definitively confirms that East Coast legacy hubs suffer from the highest concentration of delays and logistical friction, while Phoenix provides the most reliable corporate transit experience in the nation.
Passenger Impact: The Corporate Connecting Nightmare
For corporate travelers attempting to utilize JFK or Newark, the statistical probability of encountering massive travel chaos is virtually guaranteed.
The immediate passenger impact of this structural gridlock is the total destruction of temporal predictability. When an international flight lands at JFK, executives are immediately trapped in a 24-minute customs queue. This is immediately followed by a 65-minute battle against heavy highway congestion along the infamous Van Wyck Expressway, officially the longest urban transit window recorded among all major airports evaluated. This prolonged transfer time routinely forces business professionals to abandon traditional car services in favor of complex rail connections simply to reach Midtown landmarks on time. At Newark, the reality is even starker: a 30 per cent flight disruption rate means nearly one-in-three passengers will experience a severe delay or outright flight cancellation, stranding them in congested terminal buildings and virtually guaranteeing missed corporate engagements.
Industry Analysis: Bypassing the East Coast Paralysis
Aviation industry analysts view these staggering stress scores as definitive proof of a broader, systemic capacity crisis gripping the entirety of the modern American aviation network.
Analysts note that airfields originally designed decades ago, like JFK and Chicago O’Hare (which also landed firmly within the top ten), are systematically buckling under the weight of historic passenger volumes and hyper-congested regional flight paths. Predicting reliable urban transit times throughout the metropolitan area has become virtually impossible due to crumbling regional infrastructure. In stark contrast, airfields that actively invest in automated customs processing and streamlined terminal designs allow executives to maintain an uninterrupted workflow. Phoenix Sky Harbor International Airport officially ranks as the absolute least stressful major aviation hub, boasting a disruption rate of just 20.5 per cent. Other notable sanctuaries include Norman Y. Mineta San Jose International and Hartsfield-Jackson Atlanta International Airport, heavily proving that highly optimized, low-stress transit is entirely achievable outside of New York.
Actionable Advice for Bypassing the New York Gridlock
While standard passengers cannot control runway sequencing bottlenecks or crumbling highway infrastructure, you can execute this strategic survival checklist to actively manage the travel chaos affecting JFK and Newark:
- Reroute Through the Sanctuaries: If you are planning a massive corporate summit, actively avoid booking flights through New York. Reroute your personnel through Phoenix Sky Harbor or Hartsfield-Jackson Atlanta. You will mathematically drastically reduce your exposure to sudden flight cancellations.
- Abandon the Black Car at JFK: Never attempt to drive from JFK into Manhattan during rush hour. The 65-minute average is frequently doubled by accidents. Abandon the highway entirely and utilize the AirTrain connection to the Long Island Rail Road (LIRR) at Jamaica Station to guarantee your arrival time in Midtown.
- Pad Your Newark Connections: With a massive 30 per cent flight disruption rate, booking a tight 45-minute connection through Newark is a guaranteed failure. If you must transit through this hub, pad your itinerary with at least a three-hour layover to absorb the inevitable delays.
FAQ: Most Stressful US Airports
Which airport was named the most stressful in the United States?
A new corporate study by Booking.com for Business officially ranked New York’s John F. Kennedy International Airport (JFK) as the most stressful hub, citing severe customs delays and brutal 65-minute ground commutes.
Why is Newark Liberty International considered highly stressful?
Newark secured second place with a score of 7.99 out of 10, primarily because it suffers from a staggering 30 per cent flight disruption rate, causing massive travel chaos and frequent flight cancellations.
Which American airport is considered the least stressful for corporate travelers?
Phoenix Sky Harbor International Airport officially ranks as the least stressful major aviation hub, maintaining a highly impressive, low disruption rate of just 20.5 per cent.
The Reality of Combating East Coast Hub Saturation
The damning data generated by this comprehensive stress index proves definitively that America's legacy aviation hubs remain entirely susceptible to catastrophic, rolling travel chaos. By cementing JFK and Newark as the ultimate corporate nightmares, the study highlights the extreme volatility of highly congested scheduling and poor urban infrastructure. As major airlines desperately attempt to shuffle aircraft to recover their destroyed itineraries—frequently stranding corporate passengers in these heavily congested terminals—travelers must accept a critical new reality: surviving the East Coast skies requires aggressive itinerary padding, a thorough understanding of alternative rail transit, and a ruthless willingness to reroute entirely through low-stress sanctuaries like Phoenix whenever possible.
Key Takeaways
- JFK is America's Most Stressful Hub: John F. Kennedy International Airport ranked #1 for travel chaos, scoring an 8.06/10 due to severe customs queues (24m 48s) and brutal commutes (65m).
- Newark Suffers Massive Disruptions: Newark Liberty International placed second (7.99/10), hampered by a staggering 30% flight disruption and cancellation rate.
- Secondary Hubs Share the Pain: Ontario International (CA) and Fort Lauderdale (FL) tied for a highly frustrating third place due to localized airspace crowding.
- Phoenix Provides a Sanctuary: Phoenix Sky Harbor International Airport officially ranks as the least stressful hub, boasting a low 20.5% disruption rate.
- Corporate Productivity Destroyed: The chronic airport disruptions at major East Coast gateways are severely draining billable hours and destroying time-sensitive itineraries.
Related Travel Guides
Massive Travel Chaos Paralyzes Chicago O'Hare with 1,425 Disruptions
Disclaimer
This article is for informational and educational purposes only. It does not constitute legal, financial, or professional advice. While we strive to provide accurate and up-to-date information, travel policies, regulations, and conditions change rapidly. Always verify information with official sources before making travel decisions. Nomad Lawyer makes no representations about the accuracy, reliability, completeness, or suitability of the information provided. Readers should consult qualified professionals for advice specific to their circumstances. The views expressed in this article are those of the author and do not necessarily reflect the views of Nomad Lawyer.

Kunal K Choudhary
Co-Founder & Contributor
A passionate traveller and tech enthusiast. Kunal contributes to the vision and growth of Nomad Lawyer, bringing fresh perspectives and driving the community forward.
Learn more about our team →