
Illinois Joins New Jersey and More US States Where EV Road Trips Are Getting Harder for Drivers
Illinois Joins New Jersey and More US States Where EV Road Trips Are Getting Harder for Drivers

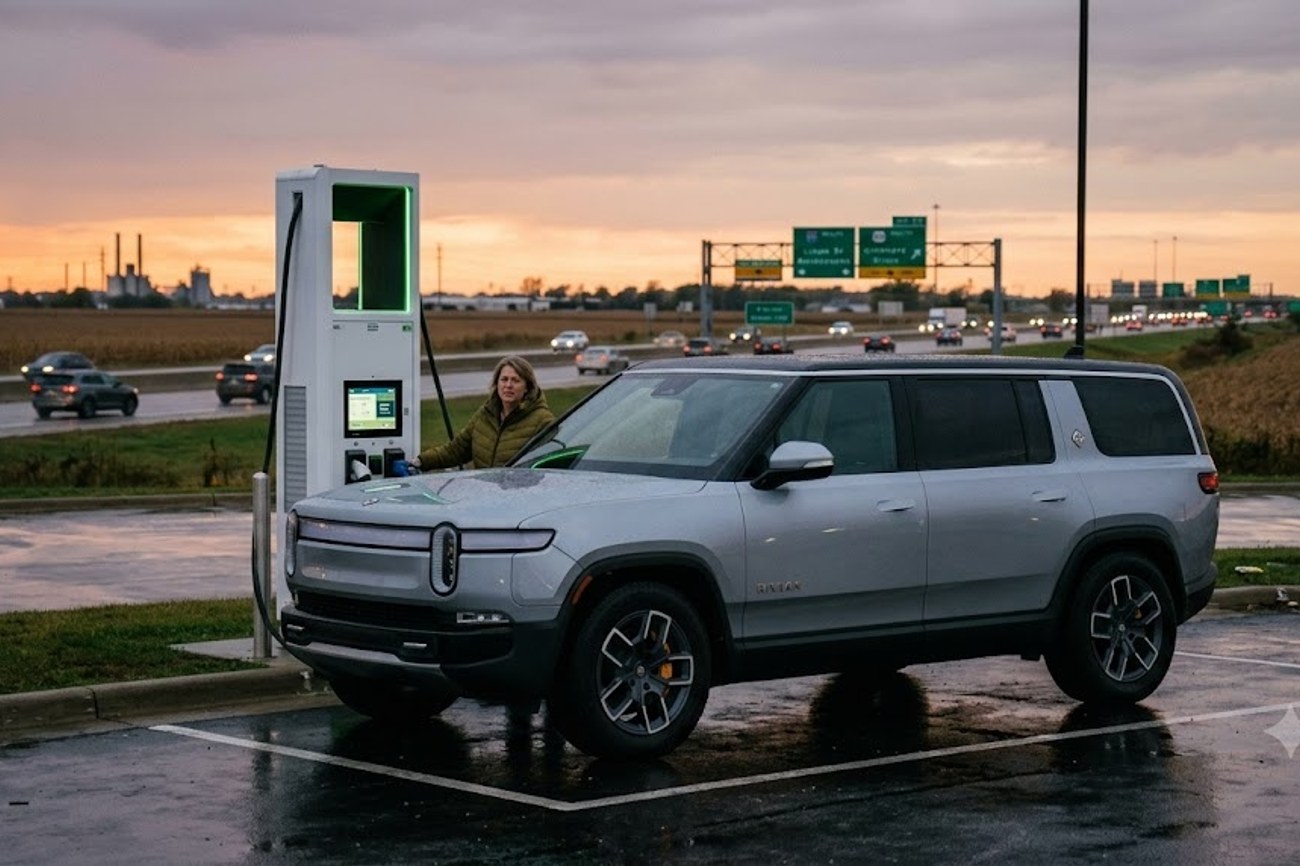
Image generated by AI
A ratio of 74 registered electric vehicles for every single charging station in New Jersey signals a widening gap between government-led adoption targets and the physical reality of roadside infrastructure. While federal and state policies have historically pushed consumers toward electrification through purchase incentives, the operational reality for the American road-tripper is shifting toward a state of "charging anxiety." According to an August 2026 study by Law Bear, the logistical burden of owning an EV is no longer just a concern for early adopters in rural areas; it has become a systemic failure in some of the most densely populated corridors of the United States.
The Infrastructure Deficit in the Northeast and Midwest
The current crisis in EV utility is best illustrated by the "EV Inconvenience Score," a metric that balances vehicle population against available charging ports, electricity costs, and registration fees. New Jersey currently holds the most precarious position in the country with a score of 96 out of 100. Despite a fleet of nearly 135,000 registered electric vehicles, the state possesses only 1,829 charging stations. When broken down to the port level, approximately 22 vehicles are competing for every single plug.
This bottleneck is not an isolated incident. Illinois has recently entered the top 10 most inconvenient states, ranking tenth with a score of 72. The Midwest corridor is seeing a similar trend where the growth of the fleet is outstripping the installation of high-speed chargers. In Illinois, the ratio stands at 54 registered EVs per station and 17 EVs per charging port. This creates a volatile environment for long-distance travelers who cannot rely on "plug-and-go" availability, particularly during peak travel seasons or holiday weekends.
The financial structure of EV ownership in these states also presents a contradiction. New Jersey offers a purchase tax credit of up to $4,000 to lure buyers into the market, yet it imposes a $260 annual registration fee to recoup lost fuel tax revenue. This "carrot and stick" approach helps the initial sale but increases the long-term cost of ownership, effectively taxing the driver for choosing a greener alternative.
Regional Breakdown of EV Inconvenience
The following data highlights the disparity between vehicle volume and infrastructure across the most challenged US states as of August 2026:
| State | Inconvenience Score | Registered EVs | Charging Stations | EVs per Station | Annual Reg Fee |
|---|---|---|---|---|---|
| New Jersey | 96 | 135,000 | 1,829 | 74 | $260 |
| Hawaii | 92 | 25,600 | 420 | 61 | N/A |
| California | 87 | 1,200,000+ | 20,166 | 62 | $118 |
| Washington | 85 | 152,000 | 3,000 | 51 | $150 |
| Nevada | 82 | 47,300 | 683 | 69 | $0 |
| Arizona | 78 | Not Listed | Not Listed | 56 | Not Listed |
| New York | 73 | Not Listed | Not Listed | 25 | Not Listed |
| Illinois | 72 | Not Listed | Not Listed | 54 | $100 |
Expert Analysis: The Fallacy of Scale and the Cost of Energy
For travelers booking rentals or planning cross-country journeys, the data reveals a critical insight: scale does not equal accessibility. California serves as the primary case study for this phenomenon. Despite having the largest EV ecosystem in the world with over 1.2 million registered vehicles and more than 20,000 stations, it still ranks third for inconvenience with a score of 87. The sheer volume of users creates a "congestion effect" at charging hubs that mirrors the traffic jams found on the I-5 or Highway 1.
The direct consequence for the nomad or the business traveler is that "available" chargers on a map do not guarantee "accessible" power. When 62 vehicles compete for a single station in California, the probability of encountering a queue or a broken port increases exponentially. This is further complicated by the International Air Transport Association (IATA) and other global bodies noting the shift toward integrated multi-modal travel; however, the "last mile" of the journey—the drive from the airport to the hotel—is becoming the most stressful segment for EV users.
Furthermore, the economic advantage of EVs is evaporating in specific geographies. In Hawaii, electricity prices have surged to approximately 48 cents per kilowatt-hour. When combined with a high EV-to-station ratio (61:1) and a score of 92, the financial incentive to switch from internal combustion engines vanishes. For the traveler, this means that the "cheaper fuel" narrative is a regional myth. In high-cost energy zones, the cost per mile can rival or exceed traditional gasoline, especially when factoring in the average EV purchase price of over $40,000 and the steep depreciation curves associated with battery aging.
Finally, the environmental factor introduces a hidden logistical risk. Washington state, ranking fourth with a score of 85, highlights the impact of climate on range. With an average temperature of 48°F, battery efficiency drops, meaning the "estimated range" displayed on a dashboard is often an optimistic fiction. Travelers in the Pacific Northwest must plan for a 10-20% range reduction, effectively increasing the number of required stops on a route where there are already only 3,000 stations for 152,000 cars.
Key Takeaways
- Infrastructure Lag: New Jersey is currently the most difficult state for EV travel, with a staggering 74 vehicles competing for every charging station.
- The Cost Paradox: High electricity rates in states like Hawaii (48 cents/kWh) and registration fees in New Jersey ($260/year) are eroding the promised financial benefits of electric ownership.
- Scale Failures: Even in EV-heavy California, high adoption rates have led to an inconvenience score of 87, proving that more chargers do not necessarily mean easier access.
- Climate Impact: Cold-weather states like Washington (avg. 48°F) face a double burden of limited infrastructure and reduced battery efficiency, complicating long-distance trip planning.
- Funding Concerns: A reduction in federal funding for charging networks threatens to widen the gap between vehicle sales and port availability.
FAQ: US EV Road Trips 2026
Which US state is currently the hardest for EV drivers? New Jersey is ranked as the least convenient state for EV ownership in 2026, with an Inconvenience Score of 96 and a ratio of 74 registered EVs per charging station.
Does California have enough chargers for its EV population? Despite having over 20,166 stations, California still ranks third for inconvenience (score of 87) because its massive fleet of 1.2 million EVs creates significant pressure on available ports.
How does cold weather affect EV road trips in states like Washington? Average temperatures around 48°F can reduce battery efficiency and overall driving range, requiring travelers to plan for more frequent charging stops than the vehicle's software may suggest.
Are EVs actually cheaper to run in all states? No. In states like Hawaii, where electricity costs can reach 48 cents per kWh, the traditional cost savings of electric driving are significantly diminished.
The dream of the seamless electric road trip is currently colliding with the reality of underfunded infrastructure and regional energy spikes.
Tags: New Jersey EV Infrastructure, Law Bear 2026 Study, US EV Registration Fees, California Charging Congestion, Illinois EV Access
Related Travel Guides
- Oman Goes Hand In Hand With More Middle East Countries To Redefine Tourism Through Culture, Sustainable Growth And Regional Unity
- UAE and Saudi Arabia Turbocharges with New Robotic and AI Integration to Boom Travel Technology to These Surprising Levels
- Canada’s Vancouver International Airport Revolutionises Passenger Travel With Powerful Digital Map Technology For Faster And Stress-Free Journeys
Disclaimer
This article is for informational and educational purposes only. It does not constitute legal, financial, or professional advice. While we strive to provide accurate and up-to-date information, travel policies, regulations, and conditions change rapidly. Always verify information with official sources before making travel decisions. Nomad Lawyer makes no representations about the accuracy, reliability, completeness, or suitability of the information provided. Readers should consult qualified professionals for advice specific to their circumstances. The views expressed in this article are those of the author and do not necessarily reflect the views of Nomad Lawyer.
Raushan Kumar
Founder & Lead Developer
Full-stack developer with 11+ years of experience and a passionate traveller. Raushan built Nomad Lawyer from the ground up with a vision to create the best travel and law experience on the web.
Learn more about our team →