
Caribbean Cruises Dominate US Travel in 2027 as Passenger Forecast Hits Record 22.4 Million
AAA projects 22.4 million Americans will cruise in 2027—a 57% surge over 2019—with the Caribbean capturing 71% of demand and Florida ports handling nearly 27% of volume.

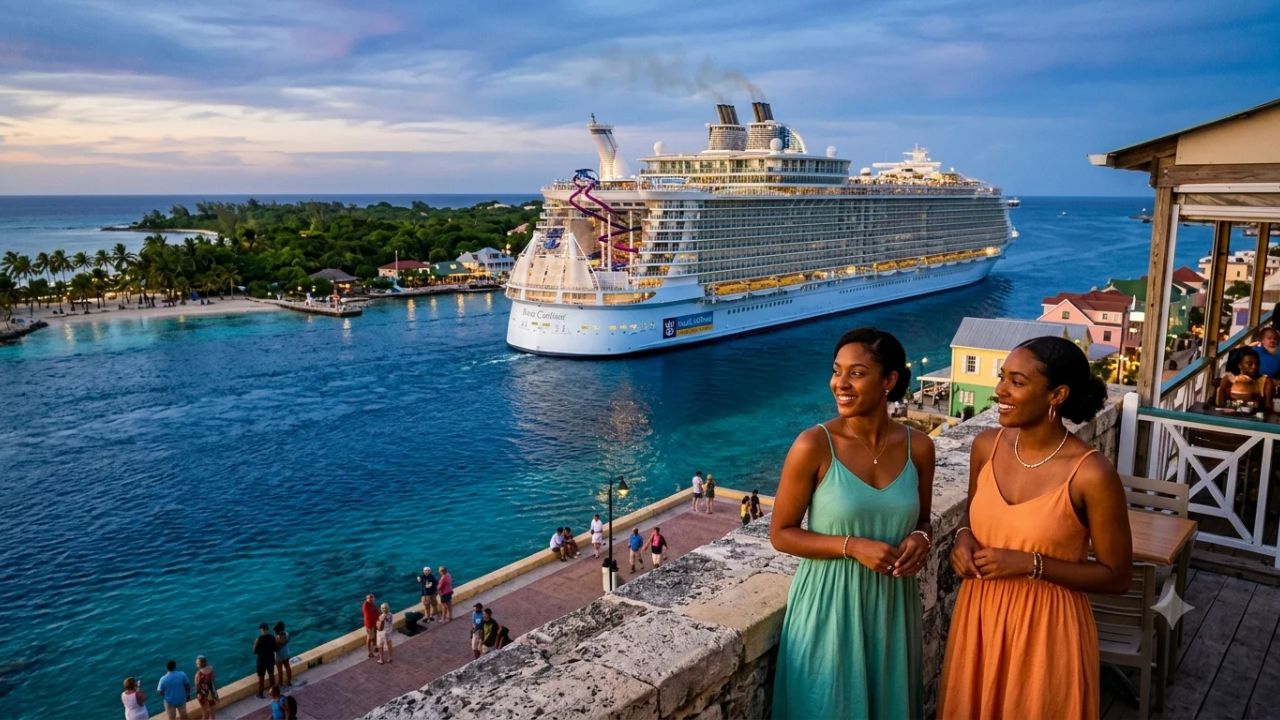
Large ocean liners operating Caribbean itineraries from Florida departure gateways
[MIAMI, Oct 21, 2026] — Propelled by sustained demand for warm-weather ocean getaways and mega-resort vessels, a record-breaking 22.4 million American travelers are projected to embark on ocean cruises in 2027, according to newly released industry research from AAA and Tourism Economics. The landmark forecast marks a 3.6% year-on-year increase over 2026 and an extraordinary 57% surge compared to pre-pandemic 2019 levels, when 14.2 million US residents took ocean voyages. Reinforcing its position as the undisputed center of American cruise mobility, the Caribbean is projected to capture an overwhelming 71% of all US passenger destination choices, anchored by Florida’s maritime trifecta of Miami, Port Canaveral, and Fort Lauderdale.
The data reveals that American cruise habits are undergoing a structural evolution. While traditional seven-night itineraries remain standard, holidaymakers are increasingly pivoting toward shorter, experience-dense sailings of six nights or fewer, driven by flexible schedules, multi-generational vacationing, and high guest satisfaction ratings exceeding 90%.
[!NOTE] Key Operational Findings:
- Historic Passenger Volume: 22.4 million US residents will take ocean cruises in 2027, representing an 8.2 million passenger expansion (+57.7% unrounded, +57% reported) over 2019's 14.2 million baseline.
- Regional Concentration: The Caribbean commands 71% of US destination choices, far outpacing Alaska (7%), the Mediterranean (6%), and the rest of the world (16%).
- Florida Departure Dominance: Three Florida gateways capture nearly 27% of global passenger movements in the report's comparison: PortMiami leads at 11.2%, followed closely by Port Canaveral at 10.4% and Fort Lauderdale (Port Everglades) at 5.3%. Barcelona (4.4%) and Galveston (4.3%) round out the top five.
- Port Throughput Records: PortMiami logged 8,564,225 passengers in fiscal year 2025 (+4.02% over FY2024), while Port Canaveral handled over 8.6 million revenue passengers (+13% over FY2024).
- Rise of Micro-Cruises: In 2025, 45% of US cruisers selected itineraries of six nights or fewer, up six percentage points from 39% in 2019.
- High Repeat Intent: Over 90% of American cruisers rate their voyage as good or very good, with 93% planning to book another cruise holiday.
2027 US CRUISE PASSENGER DISTRIBUTION & DEPARTURE NETWORK
| Column 1 |
|---|
| [TOTAL PROJECTED US CRUISE PASSENGERS: 22.4 MILLION] (+57% vs 2019 Baseline) |
| +---> DESTINATION PREFERENCE SHARE |
| +---> LEADING GLOBAL EMBARKATION & DISEMBARKATION GATEWAYS |
| * PortMiami (Florida): 11.2% Share (8.56M Pax in FY25) |
| * Port Canaveral (Florida): 10.4% Share (8.60M+ Pax in FY25) |
| * Fort Lauderdale / Port Everglades (Florida): 5.3% Share |
| * Barcelona (Spain): 4.4% Share |
| * Galveston (Texas): 4.3% Share |
| +---> ITINERARY LENGTH DYNAMICS |
| * 6 Nights or Fewer: 45% of Bookings (Up from 39% in 2019) |
| * 7 Nights or Longer: 55% of Bookings (Traditional Week-Long Standard) |
Record US Demand Signals a Permanent Post-Pandemic Baseline
The projected 22.4 million American cruisers in 2027 solidifies ocean cruising as one of the fastest-recovering segments of the international travel economy. After surpassing pre-pandemic levels in 2023, US passenger volume has maintained a consistent upward trajectory. AAA’s previous forecast issued in October 2025 projected 21.7 million American passengers for 2026; the 2027 figure raises this target by an additional 700,000 travelers, establishing a fifth consecutive annual peak.
The comparison with 2019 illustrates the magnitude of this market expansion. In 2019, approximately 14.2 million Americans sailed on ocean liners. The 2027 projection of 22.4 million passengers represents a net increase of 8.2 million travelers, reflecting a 57% overall increase (+57.7% calculated directly from rounded benchmark figures).
The research methodology developed by AAA in cooperation with Tourism Economics evaluates scheduled vessel deployments, macroeconomic indicators, and broader travel-sector shifts. Crucially, this forecast measures US residents taking ocean voyages from both domestic homeports and overseas embarkation hubs. It does not measure foreign visitors entering the United States, nor is it restricted to departures strictly from American soil.
For travel advisors, cruise operators, and destination managers, this forecast confirms continuing demand across maritime transit. However, industry stakeholders must account for seasonal capacity and local infrastructure limits rather than assuming uniform growth across all routes.
Why the Caribbean Commands 71% of American Cruise Demand
The Caribbean’s 71% share of projected US cruise passengers underscores its unique geographical and operational dominance. Alaska follows with 7%, while the Mediterranean accounts for 6%, leaving other global destinations to represent the remaining 16%.
The Caribbean combines accessible departure ports, tropical weather, island-hopping itineraries, and extensive shipboard entertainment. Cruise lines have also invested heavily in private island destinations and larger vessels carrying at least 4,500 passengers. These ships offer extensive dining and recreational amenities, turning the vessel itself into a major component of the vacation.
However, a private-island stop does not mean passengers can explore every part of a destination independently. Shore access, excursion availability, and port dwell times depend on specific itineraries. Travelers must evaluate full port schedules rather than booking based solely on destination names.
The Caribbean’s 71% share describes destination distribution within AAA’s US passenger forecast, not the Caribbean’s share of all global cruise travelers—a distinction that matters when comparing regional figures with international statistics.
| Cruise Destination | Projected Share of US Passengers in 2027 | Main Appeal | Planning Consideration |
|---|---|---|---|
| Caribbean | 71% | Tropical beaches, island visits, and large resort-style ships | Compare port calls, excursion costs, and seasonal weather |
| Alaska | 7% | Glaciers, wildlife, and dramatic coastal scenery | The operating season is shorter, and cabin availability can be limited |
| Mediterranean | 6% | Historic cities, cultural attractions, and varied coastal destinations | Check port distances, sightseeing time, and seasonal temperatures |
| Rest of the World | 16% | A broad mix of international routes and specialist itineraries | Compare flight connections, visa requirements, and itinerary length |
For travelers prioritizing a beach-focused break, the Caribbean offers the widest choice within this forecast. Alaska provides a markedly different experience, with nature and scenery taking precedence over tropical resort activities. Mediterranean itineraries combine multiple countries and historic cities within a single sailing, while the 16% allocated to other destinations reflects significant American interest in specialized global routes.
Florida Departure Ports Anchor the Global Cruise Network
Florida is central to the forecast, with Miami, Port Canaveral, and Fort Lauderdale identified as the three busiest cruise ports worldwide in AAA’s report. Their combined position reflects the strength of the state’s cruise infrastructure and its proximity to major Caribbean itineraries.
AAA’s forecast assigns Miami an 11.2% share of passenger embarkations and disembarkations, followed by Port Canaveral at 10.4% and Fort Lauderdale at 5.3%. Barcelona and Galveston complete the top five, with shares of 4.4% and 4.3%, respectively.
These percentages measure port activity within the forecast’s reported comparison. They should not be confused with each port’s share of all American cruise travelers, since AAA’s overall passenger estimate includes US residents sailing from international ports.
| Cruise Port | Reported Share | Location | Practical Advantage |
|---|---|---|---|
| Miami | 11.2% | Miami, Florida | Access to South Florida and Caribbean itineraries |
| Port Canaveral | 10.4% | Near Orlando, Florida | Potential to combine a cruise with Orlando attractions |
| Fort Lauderdale | 5.3% | Fort Lauderdale, Florida | Access to South Florida accommodation and transport |
| Barcelona | 4.4% | Barcelona, Spain | Gateway to Mediterranean itineraries and city sightseeing |
| Galveston | 4.3% | Galveston, Texas | Departure option for travelers exploring the Texas Gulf Coast |
Recent port results provide additional context for Florida’s importance. PortMiami recorded 8,564,225 cruise passengers in fiscal year 2025, a 4.02% increase from 8,233,056 in the previous fiscal year. Port Canaveral reported more than 8.6 million revenue passenger movements in fiscal year 2025, representing a 13% increase over fiscal 2024. These historical port figures illustrate the massive operational scale supporting the wider cruise sector.
For travelers, choosing a departure port involves more than finding the lowest cruise fare. Airport transfers, hotel prices, parking, luggage arrangements, and embarkation timing materially affect total holiday costs.
Global Cruise Growth Offers Wider Context
American demand forms part of a much larger international industry. The Cruise Lines International Association (CLIA) reported 34.6 million global cruise passengers in 2024 and projected 37.7 million for 2025. Its May 2025 industry report estimated more than $168 billion in global economic impact and 1.6 million jobs supported by cruise tourism.
CLIA’s 2025 global reporting subsequently put worldwide cruise passenger volume at approximately 37 million for that year. It identified the Caribbean as the leading global destination, attracting 44% of passengers, or more than 16 million guests. Europe, including the Mediterranean, ranked second among destination regions.
These figures should not be treated as a direct like-for-like comparison with AAA’s 2027 forecast. CLIA measures worldwide cruise activity across all nationalities, while AAA estimates ocean voyages taken specifically by US residents.
| Indicator | Reported Figure | What It Tells Readers |
|---|---|---|
| US cruise passengers, 2019 | 14.2 million | Pre-pandemic comparison point |
| US cruise passengers, 2027 forecast | 22.4 million | Expected American passenger volume |
| Forecast US growth, 2026–2027 | 3.6% | Projected year-on-year expansion |
| Global cruise passengers, 2024 | 34.6 million | Historical worldwide passenger volume |
| Global cruise passengers, 2025 | Approximately 37 million | Reported global industry scale |
| Caribbean share of global passengers, 2025 | 44% | The region’s worldwide destination position |
The comparison highlights the Caribbean’s influence at both regional and global levels. It also shows why port investment, destination management, and passenger services matter beyond the United States. Cruise growth creates opportunities for local businesses, but destinations must also manage visitor flows, transport demand, and pressure on popular sites.
Shorter Cruises Are Changing Holiday Choices
Cruise growth is not simply about passenger numbers. AAA’s forecast also identifies shorter itineraries as an important trend, particularly for travelers balancing holidays with work, education, and family commitments. Seven-night cruises remain the most popular duration, yet shorter breaks are attracting an expanding share of American passengers.
In 2025, 45% of US ocean-cruise passengers booked itineraries lasting six nights or fewer, compared with 39% in 2019. The six-percentage-point increase demonstrates that shorter cruises have become a prominent choice for time-conscious travelers.
For first-time passengers, a shorter itinerary provides an introduction to cruising without requiring a full week away. It also helps families coordinate school holidays and allows travelers to combine a sailing with an extended land-based trip.
However, a shorter cruise is not automatically cheaper overall. Travelers must compare base fares, transport to the departure port, hotel stays, onboard purchases, and excursion expenses. A lower headline price can become less attractive when ancillary costs accumulate.
Strong customer satisfaction underpins this growth. AAA reports that more than 90% of US cruise passengers rate their experience as good or very good, while 93% book again. These figures indicate robust repeat demand, reinforcing the need for travel advisors to match itinerary length, ship facilities, and shore experiences to individual client preferences.
Essential Pre-Booking Checklist for Cruise Travelers
With demand expected to rise again, early planning helps travelers secure suitable cabins and departure dates. AAA recommends booking early, particularly for Alaska, where the shorter sailing season restricts available inventory. Travelers should also familiarize themselves with their cruise line’s mobile app before departure.
One essential precaution concerns flights: AAA advises passengers to arrive in the departure city the day before their cruise to provide a buffer against aviation delays and cancellations.
Travel insurance deserves equal attention. Policies differ in their coverage of missed departures, medical emergencies, cancellations, and unexpected lodging. Travelers should review exclusions carefully to ensure coverage applies to their specific cruise and destination.
| Booking Consideration | Recommended Action | Why It Matters |
|---|---|---|
| Cabin availability | Compare dates and cabin categories early | Popular sailings may have limited suitable options |
| Flights | Arrive at the port city a day before departure | Reduces exposure to same-day flight disruption |
| Total budget | Include gratuities, drinks, excursions, and transfers | The advertised fare may not cover every holiday expense |
| Travel documents | Check passport validity, visas, and entry requirements | Requirements vary by itinerary and nationality |
| Insurance | Review cancellation, medical, and missed-departure cover | Protection depends on policy terms and exclusions |
| Shore excursions | Compare organized tours with independent options | Helps balance cost, convenience, and time ashore |
| Port transfers | Confirm terminal location and transfer arrangements | Different terminals and transport options affect journey times |
These checks are particularly important for international travelers departing from US ports. Visitors should confirm their US entry permissions, transit arrangements, and destination-specific requirements through relevant official authorities.
Caribbean Growth Brings New Opportunities and Operational Challenges
The projected expansion creates opportunities across the cruise supply chain. Port operators benefit from passenger services, terminal activity, and associated transport demand. Hotels, restaurants, tour operators, and transfer providers also attract spending from passengers arriving before departure or staying after disembarkation.
However, higher passenger volumes do not automatically translate into equal benefits for every destination. Local outcomes depend on visitor spending patterns, port arrangements, excursion choices, and the ability of communities to accommodate demand.
CLIA’s 2025 industry report found that 69% of cruise passengers stayed at least one night in a hotel as part of their travel arrangements. It also reported that six in ten cruisers returned to a destination they had first visited by cruise. These findings underline the potential for cruise tourism to support travel beyond the hours spent in port.
At the same time, destinations face practical challenges. Concentrated arrivals increase demand for roads, public transport, attractions, and local services. Cruise operators and tourism authorities must manage visitor flows while preserving the quality of host communities.
For travel businesses, the central opportunity lies in developing products around the entire journey. Pre-cruise hotel packages, reliable transfers, accessible excursions, and carefully timed sightseeing improve the passenger experience while extending local tourism spending.
Strong Demand Leaves Room for Choice
The latest forecast presents a confident outlook for the cruise sector, but travelers should not interpret record demand as a reason to book without comparing options. The Caribbean’s projected 71% share confirms its leading position among American cruise passengers. Nevertheless, Alaska, the Mediterranean, and other international itineraries offer different experiences that may better suit particular budgets, interests, or travel schedules.
The industry’s next challenge will be to turn passenger growth into dependable service, compelling itineraries, and meaningful benefits for destination communities. Port capacity, customer expectations, and travel costs will all influence how that expansion unfolds. For travelers, early preparation and careful comparison remain essential.
Frequently Asked Questions (PAA)
How many Americans are projected to take a cruise in 2027?
According to the latest forecast from AAA and Tourism Economics, 22.4 million Americans are projected to take ocean cruises in 2027. This represents a 3.6% increase over 2026 and a 57% increase compared to the 14.2 million American passengers recorded in 2019.
Why does the Caribbean capture 71% of US cruise demand?
The Caribbean dominates American cruise travel due to its tropical climate, close proximity to major US homeports in Florida and the Gulf Coast, extensive private island investments by major cruise lines, and the deployment of modern resort-style ships carrying 4,500 or more passengers.
Which cruise departure ports are the busiest in the United States?
Florida is home to the three busiest cruise ports worldwide: PortMiami (handling 11.2% of comparative passenger movements), Port Canaveral (10.4%), and Fort Lauderdale's Port Everglades (5.3%). In fiscal year 2025, PortMiami handled over 8.56 million passengers, while Port Canaveral handled over 8.6 million revenue passengers.
Why are shorter cruises of six nights or fewer growing in popularity?
In 2025, 45% of US cruise passengers booked voyages of six nights or fewer, up from 39% in 2019. Shorter cruises provide time-efficient holidays for travelers balancing work and school schedules, serve as an introduction for first-time cruisers, and can be easily combined with land-based resort trips.
Why does AAA advise cruise travelers to arrive a day before departure?
Arriving in the departure city at least 24 hours before your cruise provides an essential buffer against flight cancellations, weather delays, highway traffic, and lost luggage. Because cruise ships operate on strict maritime departure schedules, missing your embarkation window can result in being left behind at the port.
Related Travel Guides
- Puerto Rico Aligns With Caribbean and Latin America to Boost Cruise Tourism and Expand Local Economic Benefits
- South Pacific Cruise Accessibility Under Scrutiny as Australia, Fiji, and Vanuatu Tender Barriers Restrict Island Excursions
- Travelers Discussing Caribbean Cruise Itinerary Length and Port Selection on Reddit
Disclaimer
This article is for informational and educational purposes only. It does not constitute legal, financial, or professional advice. While we strive to provide accurate and up-to-date information, travel policies, regulations, and conditions change rapidly. Always verify information with official sources before making travel decisions. Nomad Lawyer makes no representations about the accuracy, reliability, completeness, or suitability of the information provided. Readers should consult qualified professionals for advice specific to their circumstances. The views expressed in this article are those of the author and do not necessarily reflect the views of Nomad Lawyer.
Raushan Kumar
Founder & Lead Developer
Full-stack developer with 11+ years of experience and a passionate traveller. Raushan built Nomad Lawyer from the ground up with a vision to create the best travel and law experience on the web.
Learn more about our team →