
World Cup 2026 Flight Delay Risks: Stockton, Palm Beach, and Dallas/Fort Worth Airports Lead US Disruption Rankings
New data reveals the most delay-prone airports serving World Cup 2026 venues, with Stockton Metropolitan Airport topping the risk list as millions of fans prepare for the tournament.

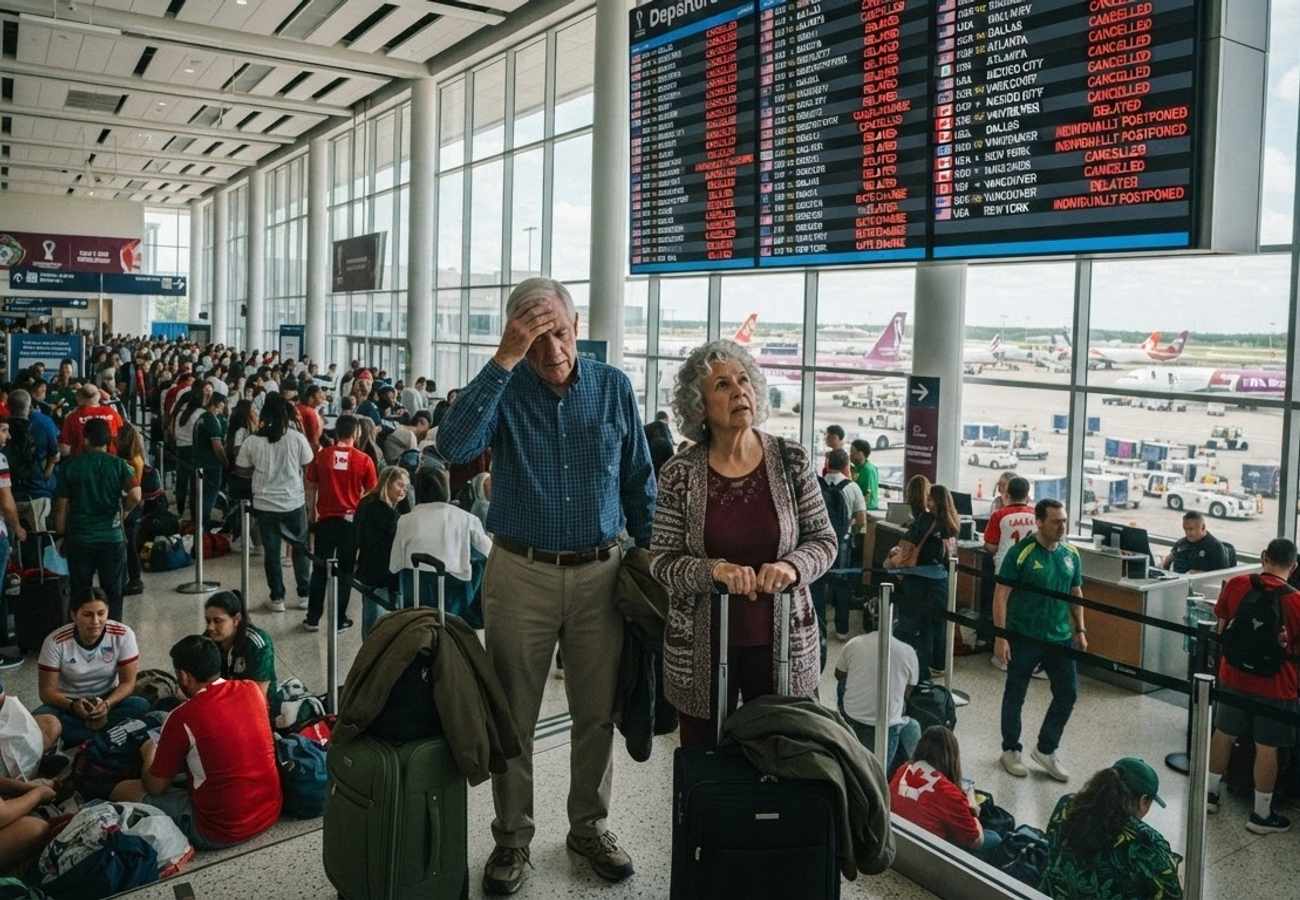
Image generated by AI
Travelers heading to the 2026 FIFA World Cup are facing a potential "delay storm" as data identifies critical pressure points across North American aviation gateways.
The 2026 FIFA World Cup is set to trigger one of the largest international migrations of people in North American history. As millions of supporters prepare to traverse the United States, Canada, and Mexico, a new analysis by Dejen—utilizing Bureau of Transportation Statistics data—has mapped the airports most likely to experience significant operational disruptions.
The Local Trend Revealed: Regional Vulnerability
While major international hubs often dominate the conversation regarding travel chaos, the 2026 data reveals a surprising trend: regional and smaller gateway airports are often more volatile than the giants. The research examined between two and six of the closest airports serving each U.S. World Cup stadium to calculate average delay percentages.
The findings indicate that limited infrastructure and fewer recovery resources at smaller airports can lead to higher percentages of disruption. For example, Stockton Metropolitan Airport, a gateway for those visiting Levi’s Stadium, recorded the highest average delay percentage in the nation at 26.20%. This suggests that as fan demand surges, these smaller facilities may lack the operational elasticity to absorb the influx of passengers.
Conversely, massive hubs like Dallas/Fort Worth International Airport (25.78%) and Newark Liberty International Airport (24.21%) are also high-risk zones, though their challenges stem from sheer passenger volume and the complexity of connecting flights.
World Cup 2026 Airport Delay Rankings by Stadium Gateway
The following data outlines the average flight delay percentages for airports serving key tournament venues:
| Rank | Airport Name | Average Flight Delay % | Nearby Stadium |
|---|---|---|---|
| 1 | Stockton Metropolitan Airport | 26.20% | Levi’s Stadium |
| 2 | Palm Beach International Airport | 25.84% | Hard Rock Stadium |
| 3 | Dallas/Fort Worth International Airport | 25.78% | AT&T Stadium |
| 4 | Trenton-Mercer Airport | 24.34% | Lincoln Financial Field |
| 5 | Newark Liberty International Airport | 24.21% | MetLife Stadium & Lincoln Financial Field |
| 6 | Lincoln Airport | 24.17% | Arrowhead Stadium |
| 7 | Miami International Airport | 23.79% | Hard Rock Stadium |
| 8 | Boston Logan International Airport | 23.78% | Gillette Stadium |
| 9 | Dallas Love Field | 23.40% | AT&T Stadium |
| 10 | Fort Lauderdale Hollywood Intl Airport | 23.09% | Hard Rock Stadium |
| 11 | Austin-Bergstrom International Airport | 22.67% | NRG Stadium |
| 12 | Springfield-Branson National Airport | 22.45% | Arrowhead Stadium |
| 13 | McGhee Tyson Airport | 22.36% | Mercedes-Benz Stadium |
| 14 | Waco Regional Airport | 22.12% | AT&T Stadium |
| 15 | Chattanooga Metropolitan Airport | 22.08% | Mercedes-Benz Stadium |
| 16 | Columbia Regional Airport | 22.02% | Arrowhead Stadium |
| 17 | William P. Hobby Airport | 21.74% | NRG Stadium |
| 18 | New York Stewart International Airport | 21.24% | MetLife Stadium |
| 19 | Rhode Island T.F. Green Intl Airport | 21.17% | Gillette Stadium |
| 20 | Killeen Regional Airport | 21.09% | AT&T Stadium |
| 21 | San Francisco International Airport | 20.93% | Levi’s Stadium |
| 22 | Greenville-Spartanburg Intl Airport | 20.85% | Mercedes-Benz Stadium |
| 23 | John F. Kennedy International Airport | 20.51% | MetLife Stadium |
| 24 | Kansas City International Airport | 20.48% | Arrowhead Stadium |
| 25 | Hartsfield-Jackson Atlanta Intl Airport | 20.42% | Mercedes-Benz Stadium |
Cultural & Environmental Value (Information Gain)
The strain on these aviation networks provides an opportunity for travelers to shift toward more sustainable, community-focused transit. Local tourism departments and regional transit authorities are encouraging "Slow Travel" initiatives to mitigate the impact on airport infrastructure.
By utilizing regional rail networks and inter-city bus services, visitors can reduce the carbon footprint associated with short-haul "puddle jumper" flights between host cities. Supporting local shuttle cooperatives and regional ride-share programs also ensures that the economic benefits of the tournament reach smaller communities rather than just major airline conglomerates.
Visitor Insider Tips
For those navigating the 2026 tournament, standard travel advice is insufficient. Consider these strategic adjustments:
- The "Buffer Day" Rule: For airports with delays exceeding 20% (such as Stockton or Palm Beach), schedule your arrival at least 48 hours before match day.
- Diversify Your Gateway: Instead of flying directly into the highest-risk airport, consider a "hub-and-spoke" approach. For example, if flying to Hard Rock Stadium, compare the reliability of Miami International (23.79%) against Fort Lauderdale Hollywood (23.09%) or Southwest Florida International (20.39%).
- Regional Rail Alternatives: In the Northeast corridor (serving MetLife and Lincoln Financial Field), prioritize Amtrak over short flights to avoid the Newark (24.21%) and Trenton-Mercer (24.34%) delay bottlenecks.
- Off-Peak Window: Aim for mid-week arrivals. The surge in "fan-traffic" typically peaks on Thursdays and Fridays, exacerbating existing operational weaknesses.
Tourism Outlook
The long-term impact of this surge will likely force a reckoning in U.S. regional aviation. The high delay percentages at airports like Stockton and Waco highlight a critical need for infrastructure investment in secondary markets. If these gateways can modernize their capacity and recovery resources, the 2026 World Cup could serve as a catalyst for a more resilient, distributed tourism network across the United States, reducing the over-reliance on a few stressed mega-hubs.
Plan for the chaos, but travel for the game.
Related Travel Guides
Disclaimer
This article is for informational and educational purposes only. It does not constitute legal, financial, or professional advice. While we strive to provide accurate and up-to-date information, travel policies, regulations, and conditions change rapidly. Always verify information with official sources before making travel decisions. Nomad Lawyer makes no representations about the accuracy, reliability, completeness, or suitability of the information provided. Readers should consult qualified professionals for advice specific to their circumstances. The views expressed in this article are those of the author and do not necessarily reflect the views of Nomad Lawyer.
Preeti Gunjan
Contributor & Community Manager
A passionate traveller and community builder. Preeti helps grow the Nomad Lawyer community, fostering engagement and bringing the reader experience to life.
Learn more about our team →