
US Urban Tourism Trends 2026: Why NYC and San Francisco Are Seeing Diverging Visitor Economies

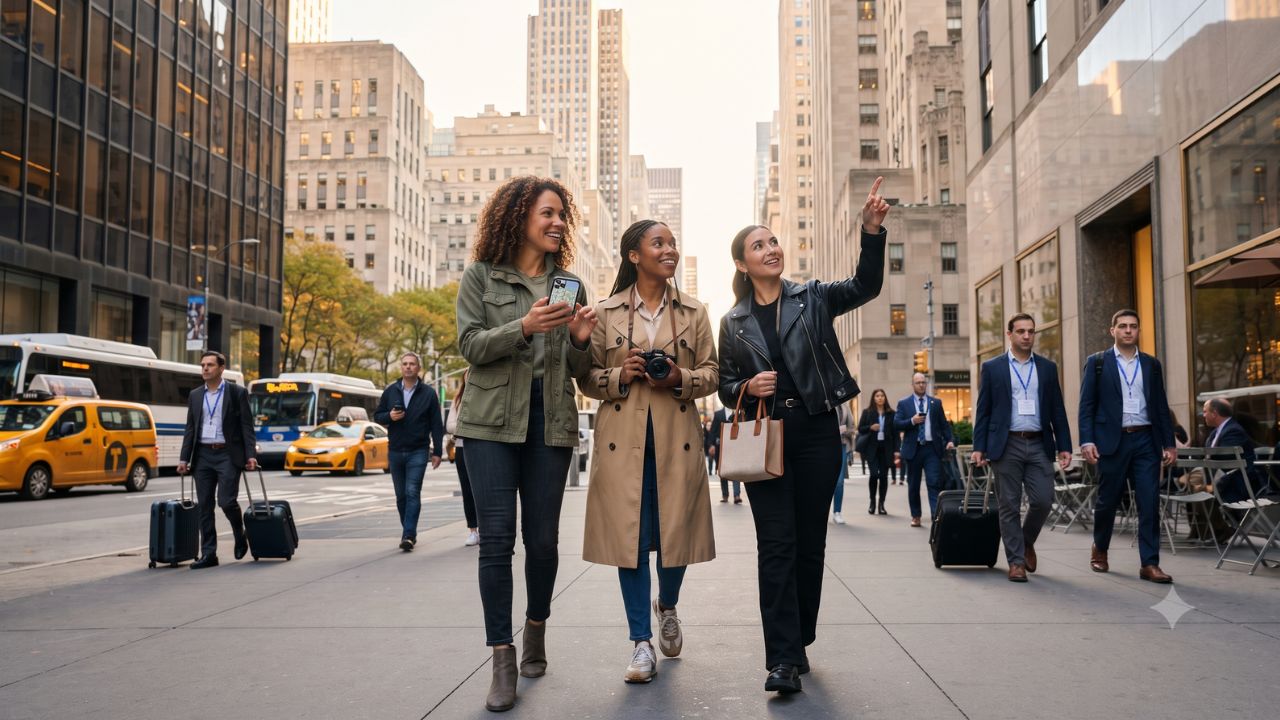
While international passenger arrivals through New York and Newark gateways contracted 6.5% during the first ten months of fiscal 2026, San Francisco's visitor economy surged in the opposite direction, projecting a record $9.9 billion in visitor expenditure. Rather than reflecting a nationwide tourism downturn, official municipal audit and tourism bureau reports reveal that America's leading metropolises are charting sharply divergent trajectories shaped by winter weather disruptions, business convention calendars, and fluctuating international currency dynamics.
For travelers, understanding these diverging urban patterns provides actionable advantages. In New York, softer early-spring demand and Broadway box-office shifts created unexpected last-minute theater access and stabilizing room rates. Meanwhile, on the Pacific Coast, major tech congresses at San Francisco’s Moscone Center and a growing influx of 2.3 million international visitors have driven downtown hotel revenue per available room (RevPAR) up 7.9%. Navigating these urban centers requires looking beneath generic headlines to understand how each destination's unique economic drivers shape the ground-level visitor experience.
The Divergence: Examining NYC Fiscal Pressures and San Francisco's Rebound
The most detailed municipal data comes from the NYC Office of the Comptroller. Analysis of non-U.S. overseas arrivals (excluding Canada and Mexico) through John F. Kennedy International Airport (JFK) and Newark Liberty International Airport revealed a 6.5% drop over the initial ten months of fiscal 2026, outpacing the 3.8% national overseas decline. This softness was compounded on 22 February by a severe late-winter blizzard that disrupted transit corridors, dampening hotel stays and Broadway theater attendance through March and early April.
Broadway box office data clearly illustrated this temporary strain: March and early April admissions fell nearly 5% year-on-year, while gross revenues dropped nearly 8%. However, broader multi-year context shows resilience: while May theatre revenues softened 6% compared to record 2025 peaks, they remained 19% higher than 2024 benchmarks, with attendance up 17%. Furthermore, between July 2025 and April 2026, New York City hotel occupancy held steady at an average of 83.1% (less than one percentage point below the previous year), while Average Daily Rates (ADR) and RevPAR both gained roughly 4%. Full-year forecasts from NYC Tourism + Conventions project 66.3 million visitors (53.4 million domestic and 12.9 million international), representing a 2% overall increase over 2025.
In contrast, the San Francisco Travel Association released an expansive 2026 outlook projecting 24.2 million total visitors and $9.9 billion in direct visitor spending—surpassing pre-2019 historical highs. The city projects international overnight arrivals to expand from 2.2 million in 2025 to 2.3 million in 2026, generating $5.2 billion in foreign visitor spending (+5.8%). Citywide hotel occupancy is forecasted at 69%, with an ADR of $257.81 and a 7.9% increase in RevPAR to $177.85.
NEW YORK CITY VS SAN FRANCISCO TOURISM METRICS 2026
| Tourism Metric | New York City | San Francisco | Key Comparative Note |
|---|---|---|---|
| Full-Year 2026 Visitors | 66.3 Million Proj. | 24.2 Million Forecast | Both project growth |
| International Visitors | 12.9 Million Proj. | 2.3 Million Overnight | SF growing (+4.5%) |
| Direct Visitor Spending | Resilient Baseline | $9.9 Billion (Record) | SF up past 2019 peak |
| Major Economic Driver | Leisure & Culture | Moscone Center Conventions | 38 events / 674k r-n |
| Hotel Occupancy Baseline | 83.1% (FY to date) | 69.0% (Annual forecast) | NYC retains density |
| Average Daily Rate (ADR) | ~4% YoY Increase | $257.81 Forecast | Both seeing ADR gain |
| RevPAR Performance | ~4% YoY Increase | $177.85 (+7.9% YoY) | Strong west rebound |
| Primary 2026 Challenge | Feb Storm / Int'l | Geopolitical headwind | Localized dynamics |
What Makes Urban Hospitality Drivers Distinct Across US Hubs
The divergence between major travel markets illustrates that American urban tourism no longer behaves as a single monolithic sector. San Francisco’s rebound is heavily anchored by convention infrastructure: the Moscone Center is hosting 38 major events in 2026 generating roughly 674,000 hotel room nights, building on the 34 events and 635,000 room nights hosted in 2025 (which itself marked a 59% increase over 2024’s 399,000 room nights).
In the Pacific Northwest, Seattle recorded 39.6 million visitors in 2025 (-0.9%), with 2026 trends showing stronger international leisure arrivals rebounding through Seattle-Tacoma International Airport. In major entertainment centers like Las Vegas, Chicago, and New Orleans, destination demand remains tied to signature sporting events, culinary tourism, and multi-day music festivals rather than general macroeconomic contractions.
MAJOR US METROPOLITAN TOURISM COMPARISON MATRIX
| Entity / Facility | Delays | Cancellations | Details |
|---|---|---|---|
| Destination Hub | 2025/2026 Volume | Primary Demand Engine | Verified Trend State |
| New York City | 66.3M (2026 proj) | Broadway, Culture, Dining | International strain |
| San Francisco | 24.2M (2026 proj) | Conventions, Asian Gateway | Broad economic gain |
| Seattle | 39.6M (2025 base) | Cruise hub, Nature gateway | International rebound |
| Las Vegas | LVCVA Monthly Base | Sports, Residency Shows | Stable leisure demand |
| Chicago | Multi-Market Base | Architectural, Food festivals | Resilient midwest hub |
| New Orleans | Festival-Led Base | Mardi Gras, Cultural events | Strong event demand |
Visitor Insider Tips
- Broadway Ticket Strategy in Manhattan: Take advantage of mid-week box-office flexibility. Rather than paying peak weekend broker premiums, visit the TKTS booth in Times Square or Lincoln Center for Wednesday matinee performances, or enter digital day-of-show rush lotteries for top-tier musical productions.
- Navigating San Francisco Convention Crowds: When planning a leisure trip to San Francisco, review the Moscone Center event schedule in advance. Downtown hotel rates in SoMa and Union Square spike significantly during major multi-day medical and tech conferences, while boutique properties in Nob Hill or the Marina maintain stable pricing.
- Airport Transit Hacks in Both Cities: In New York, bypass highway congestion by taking the AirTrain to the Long Island Rail Road (LIRR) from JFK into Grand Central or Penn Station in under 35 minutes. In San Francisco, board the direct BART rapid transit train from SFO into downtown Powell or Montgomery Street stations for under $11.
- Cultural Neighborhood Bases: In New York, base yourself in Lower Manhattan or Long Island City for fast multi-line subway connections. In San Francisco, explore culinary and arts corridors beyond downtown, including North Beach, the Mission District, and the Presidio.
Cultural and Environmental Context
As urban destinations adapt to shifting international travel patterns, municipal leadership in both New York and San Francisco has focused heavily on neighborhood equity and sustainable urban mobility. Programs in New York support cultural non-profits and outer-borough arts institutions in Brooklyn, Queens, and the Bronx, encouraging travelers to distribute spending beyond Midtown Manhattan.
In California, strict state climate mandates and urban transit investments ensure that major convention gatherings at the Moscone Center operate under zero-waste standards and LEED Platinum building guidelines. Furthermore, regional preservation efforts along San Francisco Bay and the Golden Gate National Recreation Area provide protected open space that balances urban density with coastal conservation.
FAQ: US Urban Travel & Tourism Trends 2026
Is tourism in New York City declining in 2026?
No. While international arrivals via JFK and Newark softened by 6.5% following winter storm disruptions, NYC Tourism + Conventions forecasts 66.3 million total visitors for full-year 2026, up 2% from 2025.
What is driving San Francisco's tourism growth in 2026?
San Francisco's growth to 24.2 million projected visitors and $9.9 billion in spending is driven by 38 major Moscone Center conventions generating 674,000 room nights and 2.3 million international visitors.
How did Broadway theatre perform in 2026?
Broadway experienced a temporary 5% attendance dip in early spring following the February blizzard, but box office revenues remained 19% higher and attendance 17% higher than 2024 benchmarks.
How did Seattle's tourism perform compared to other cities?
Seattle welcomed 39.6 million visitors in 2025 (a minor 0.9% drop), with 2026 indicators pointing toward stronger international recovery via transpacific flight routes.
Looking past broad national statistics reveals that America's greatest cities are carving out distinct, resilient travel experiences built on local culture, innovation, and community.
Related Travel Guides
Disclaimer
This article is for informational and educational purposes only. It does not constitute legal, financial, or professional advice. While we strive to provide accurate and up-to-date information, travel policies, regulations, and conditions change rapidly. Always verify information with official sources before making travel decisions. Nomad Lawyer makes no representations about the accuracy, reliability, completeness, or suitability of the information provided. Readers should consult qualified professionals for advice specific to their circumstances. The views expressed in this article are those of the author and do not necessarily reflect the views of Nomad Lawyer.
Raushan Kumar
Founder & Lead Developer
Full-stack developer with 11+ years of experience and a passionate traveller. Raushan built Nomad Lawyer from the ground up with a vision to create the best travel and law experience on the web.
Learn more about our team →