US Labor Day Travel Reliability Analysis: JetBlue, Frontier, and American Post Highest Delay Rates

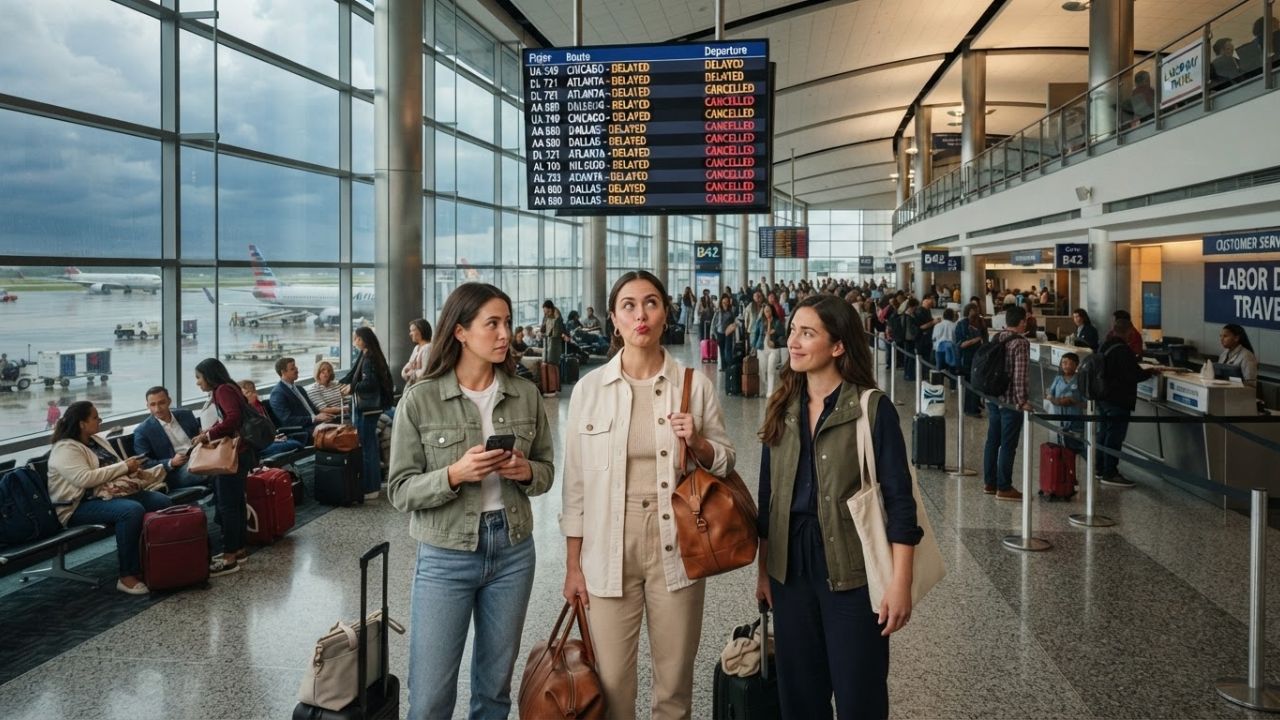
Image generated by AI
A six-year analysis of U.S. Department of Transportation on-time performance data from 2020 through 2025 reveals that JetBlue Airways, Frontier Airlines, and American Airlines logged the highest departure delay rates during Labor Day holiday travel periods.
WASHINGTON, D.C. — As millions of passengers take to the skies for the Labor Day holiday rush, historical flight performance metrics highlight a stark reliability gap among major U.S. airlines. Data compiled by RightWay Parking from official U.S. Department of Transportation (DOT) flight tracking records spanning every Labor Day period from 2020 through 2025 reveals that JetBlue Airways registered the highest proportion of delayed departures among nine major U.S. carriers at 23.1 percent.
Frontier Airlines followed closely with a 20.5 percent delay rate, while American Airlines recorded 20.1 percent. Conversely, Hawaiian Airlines and Delta Air Lines established themselves as the most reliable carriers for holiday travel, logging delay rates of just 8.3 percent and 10.0 percent respectively.
| Airline Rank | Carrier Name | Share of Departures Delayed (2020–2025) | Cancellation Rate (%) | Primary Operational Reliability Profile |
|---|---|---|---|---|
| 1 | JetBlue Airways | 23.1% | 1.4% | Highest delay share; congested Northeast corridor focus |
| 2 | Frontier Airlines | 20.5% | 1.4% | Elevated delays; ultra-low-cost point-to-point schedule |
| 3 | American Airlines | 20.1% | 2.0% | High delay rate; highest cancellation percentage |
| 4 | Southwest Airlines | 19.7% | 1.3% | High point-to-point network propagation delays |
| 5 | Allegiant Air | 18.4% | 0.8% | Moderate delay share; low cancellation rate |
| 6 | United Airlines | 14.7% | 0.9% | Mid-tier holiday performance across major hubs |
| 7 | Alaska Airlines | 12.9% | 0.5% | Strong West Coast reliability profile |
| 8 | Delta Air Lines | 10.0% | 0.4% | Strong overall execution; tied for lowest cancellations |
| 9 | Hawaiian Airlines | 8.3% | 0.4% | Lowest delay rate & tied for lowest cancellations |
JetBlue and Ultra-Low-Cost Carriers Lead Holiday Delay Totals
JetBlue’s position at the top of the delay rankings stems largely from its heavy concentration of flight operations in congested airspace corridors surrounding New York (JFK, LGA, EWR) and Boston (BOS). During peak Labor Day periods, severe weather, air traffic control ground delay programs, and crowded runways in the Northeast rapidly magnify schedule delays across JetBlue's network.
Frontier Airlines ranked second with 20.5 percent of departures delayed, while Southwest Airlines placed fourth with 19.7 percent. Point-to-point low-cost carrier models—which run tight 30-to-45-minute gate turnarounds—often suffer cascading delays when early-morning flights encounter initial air traffic holds.
| Carrier Segment | Average Labor Day Delay Rate | Primary Contributing Factor |
|---|---|---|
| Northeast Corridor Specialists (JetBlue) | 23.1% | Severe airspace congestion & weather in NY/Boston |
| Ultra-Low-Cost Operators (Frontier, Allegiant) | 18.4% – 20.5% | Tight gate turnarounds & single-aircraft multi-leg rosters |
| Major Legacy Carriers (American, United, Delta) | 10.0% – 20.1% | Variable by hub geography & fortress operational size |
Hawaiian and Delta Record Best Holiday On-Time Execution
At the top end of operational reliability, Hawaiian Airlines achieved the lowest delay rate in the six-year dataset, with only 8.3 percent of its Labor Day departures experiencing delays. Hawaiian's favorable performance is supported by stable weather patterns across inter-island routes and long-haul point-to-point connections.
Delta Air Lines delivered the strongest performance among major transcontinental legacy carriers, with a 10.0 percent delay rate. Delta's investment in hub scheduling buffer times and proactive operational management at Atlanta (ATL), Minneapolis (MSP), and Detroit (DTW) helped insulate its network from holiday travel meltdowns.
| Top Performing Carrier | Delay Rate (2020–2025) | Cancellation Rate | Key Operational Advantage |
|---|---|---|---|
| Hawaiian Airlines | 8.3% | 0.4% | Favorable island weather & point-to-point scheduling |
| Delta Air Lines | 10.0% | 0.4% | High hub buffer margins & proactive operational control |
| Alaska Airlines | 12.9% | 0.5% | Streamlined Pacific Northwest hub management |
Cancellation Metrics Reveal American Airlines Has Highest Risk
While delay rates measure schedule tardiness, flight cancellation metrics highlight outright travel disruption. American Airlines recorded the highest cancellation rate among all nine carriers studied, with 2.0 percent of its Labor Day departures cancelled between 2020 and 2025—five times higher than Delta or Hawaiian (0.4% each).
| Airline Operator | Departure Cancellation Rate | Risk Level for Holiday Passengers |
|---|---|---|
| American Airlines | 2.0% | Highest Cancellation Risk (1 in 50 flights cancelled) |
| Frontier Airlines | 1.4% | Moderate Cancellation Risk |
| JetBlue Airways | 1.4% | Moderate Cancellation Risk |
| Southwest Airlines | 1.3% | Moderate Cancellation Risk |
| United Airlines | 0.9% | Low-to-Moderate Risk |
| Allegiant Air | 0.8% | Low Cancellation Risk |
| Alaska Airlines | 0.5% | Low Cancellation Risk |
| Delta Air Lines | 0.4% | Lowest Cancellation Risk (1 in 250 flights cancelled) |
| Hawaiian Airlines | 0.4% | Lowest Cancellation Risk (1 in 250 flights cancelled) |
Airport Location Plays Crucial Role in Holiday Delay Rates
The study also analyzed performance across 45 major U.S. commercial airports, proving that departure airport choice significantly impacts holiday travel success.
Daniel K. Inouye International Airport (HNL) in Honolulu registered the lowest delay rate among major U.S. airports at 8.9 percent. Conversely, Dallas Love Field (DAL) recorded the worst overall airport delay rate at 20.7 percent, driven by dense Southwest Airlines holiday departure banks and Texas summer thunderstorm activity.
| Airport Gateway | Code | Labor Day Delay Rate | Operational Airport Profile |
|---|---|---|---|
| Honolulu International | HNL | 8.9% (Best Airport) | Stable Pacific weather & structured long-haul arrivals |
| Dallas Love Field | DAL | 20.7% (Worst Airport) | High-density Southwest hub & convective weather holds |
Frequently Asked Questions
Which U.S. airline had the highest delay rate during Labor Day travel?
JetBlue Airways recorded the highest delay rate from 2020 to 2025, with 23.1% of its holiday departures experiencing delays.
Which airline had the highest cancellation rate?
American Airlines recorded the highest cancellation rate at 2.0%—more than double the rate of major competitors like United, Alaska, Delta, and Hawaiian.
Which airline was the most reliable for Labor Day travel?
Hawaiian Airlines was the most reliable, with an 8.3% delay rate and a 0.4% cancellation rate, followed by Delta Air Lines with a 10.0% delay rate and 0.4% cancellation rate.
Which U.S. airport recorded the highest and lowest delay rates?
Daniel K. Inouye International Airport (HNL) in Honolulu had the lowest airport delay rate at 8.9%, while Dallas Love Field (DAL) had the highest at 20.7%.
Related Travel Guides
This article is for informational purposes. Flight routes, passenger regulations, visa rules, and transit advisories are subject to change by airlines and aviation authorities. Readers are advised to verify schedules and travel documentation with relevant carriers and border agencies before departure.
Related Stories

JetBlue Sparks Controversy After Listing 'Donald J. Trump' as Destination on LaGuardia Flight Boards 2026
American Airlines Hikes Co-Branded Card Fees by 51% and Restructures In-Flight Perks for 2027