
US International Air Arrivals Hit 9.6 Million in Q1 2026 as Mexico Travel Surges 15.9%
United States international air arrivals reached 9.6 million in Q1 2026, with significant growth from Mexico offsetting a decline in Canadian travel.

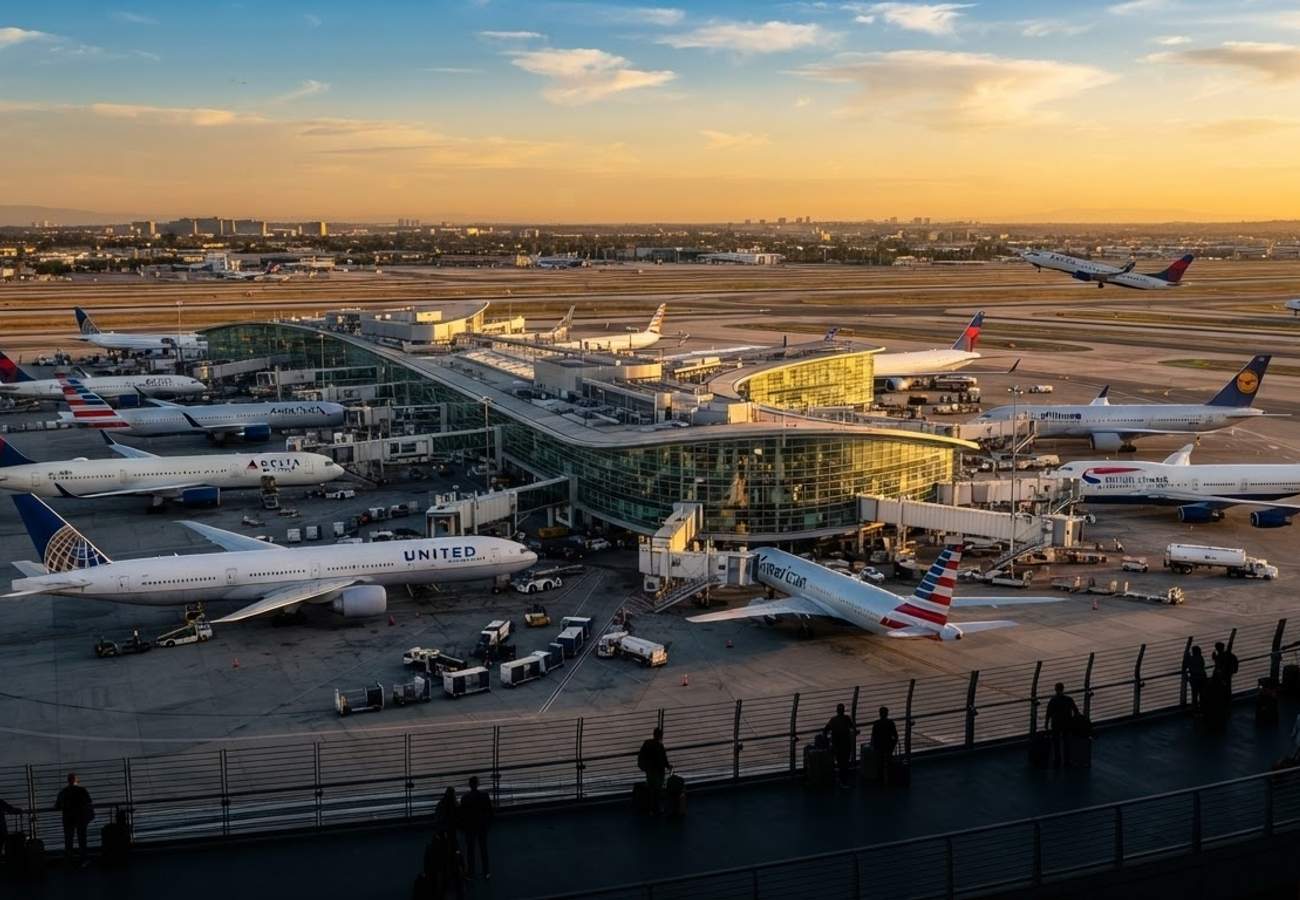
Image generated by AI
US international air arrivals totaled approximately 9.6 million in the first quarter of 2026. While overall visitation saw a slight dip, a 15.9% surge in arrivals from Mexico highlights a shifting demographic in North American travel patterns.
Q1 2026 International Arrival Metrics
Data from the National Travel and Tourism Office (NTTO) confirms that the United States welcomed 9.6 million international visitors by air during the first quarter of 2026. This represents a 1.2% decrease compared to Q1 2025, driven primarily by a contraction in the Canadian market.
The distribution of arrivals is categorized as follows:
- Overseas Markets: 6.5 million visitors (0.2% increase)
- Canada: 2.4 million visitors (8.7% decrease)
- Mexico: 756,000 visitors (15.9% increase)
Top Source Markets and Destinations
Analysis of overseas visitation reveals that five key nations account for 36% of all non-North American air arrivals. The United Kingdom leads this segment with 836,000 visitors, followed by Brazil (499,000), Japan (479,000), China (400,000), and India (370,000).
Geographic concentration remains high within the US, with five states capturing 81% of all international air traffic:
- Florida: 3.2 million
- California: 1.8 million
- New York: 1.6 million
- Nevada: 704,000
- Texas: 629,000
At the city level, New York City (1.6 million), Miami (1.5 million), and Orlando (1.4 million) remain the primary gateways, collectively with Los Angeles (976,000) and Las Vegas (678,000) accounting for 64% of total visitation.
Visitor Expenditure and Duration Trends
Our analysis of the NTTO data indicates a stark contrast in spending habits and trip lengths based on the origin of the traveler:
| Market | Avg. Trip Length | Avg. Expenditure per Trip |
|---|---|---|
| Overseas | 14.3 Days | $1,748 |
| Mexico | 8.1 Days | $1,322 |
| Canada | 7.6 Days | $994 |
Passenger Rights & Advisory
For passengers traveling into the US during these high-volume periods, the scale of disruption at major hubs like Miami and New York City increases the likelihood of delays and cancellations.
For the affected passenger, this means:
- Flight Delays and Cancellations: If you are traveling on a carrier operating from the EU or UK into the US, you may be entitled to compensation under EU261/2004 or UK261 if your flight is cancelled or delayed by more than three hours, provided the disruption is within the airline's control.
- US DOT Guidelines: For flights departing from the US or operated by US carriers, the Department of Transportation (DOT) mandates prompt refunds for significantly changed flights or cancellations, regardless of the fare type.
- Rebooking Rights: In the event of a missed connection at a major hub (e.g., JFK or MIA), airlines are generally required to rebook you on the next available flight to your destination at no additional cost if the delay was caused by the carrier.
Industry Analyst View
The 15.9% growth in Mexican air arrivals is the most significant trend in this dataset. It suggests a pivot toward higher-frequency, shorter-duration travel from the south, which offsets the 8.7% decline in Canadian arrivals. The heavy concentration of visitors in Florida and California (totaling 5 million arrivals) indicates that international demand remains tied to specific "super-hubs," placing immense pressure on airport infrastructure and ground transportation in those regions.
The stability of overseas markets (+0.2%) suggests that long-haul demand has plateaued, making the North American regional market the primary driver of volatility for US aviation capacity planning.
The shift toward Mexican aviation growth signals a strategic need for carriers to expand direct capacity beyond traditional border-state gateways.
Related Travel Guides
Disclaimer
This article is for informational and educational purposes only. It does not constitute legal, financial, or professional advice. While we strive to provide accurate and up-to-date information, travel policies, regulations, and conditions change rapidly. Always verify information with official sources before making travel decisions. Nomad Lawyer makes no representations about the accuracy, reliability, completeness, or suitability of the information provided. Readers should consult qualified professionals for advice specific to their circumstances. The views expressed in this article are those of the author and do not necessarily reflect the views of Nomad Lawyer.
Raushan Kumar
Founder & Lead Developer
Full-stack developer with 11+ years of experience and a passionate traveller. Raushan built Nomad Lawyer from the ground up with a vision to create the best travel and law experience on the web.
Learn more about our team →