
US Aviation Gridlock: Over 3,230 Delays and 140 Cancellations Strike Boston Logan, LaGuardia, and Southwest Airlines
A cascading wave of 3,235 delays and 143 cancellations disrupted US air travel, led by 433 disruptions at Boston Logan and 664 delayed Southwest flights amid FAA ground stops.

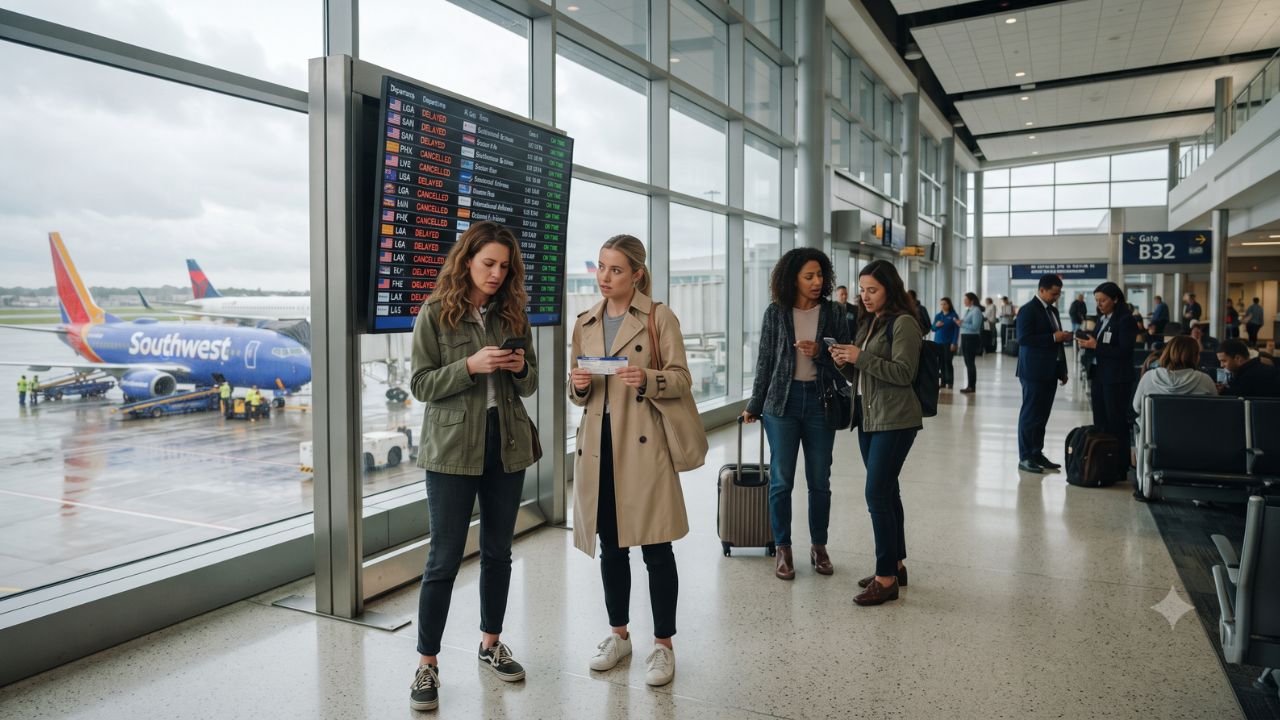
A disruptive wave of 3,235 flight delays and 143 cancellations across domestic US routes on 12 October 2026 exposed acute systemic vulnerabilities across major coastal and regional air hubs. Telemetry captured by FlightAware as of 2:14 pm ET revealed that severe weather, terminal airspace congestion, low cloud ceilings, and critical equipment failures converged to derail schedules across the Northeast, South, and Southwest corridors.
Leading the nationwide disruption, Boston Logan International Airport recorded 433 delayed flights alongside 37 cancellations, triggering mandatory flow management programs from the Federal Aviation Administration (FAA). With carriers like Southwest Airlines absorbing 664 delayed departures and legacy network operators grappling with rotational bottlenecks, the disruption left tens of thousands of business and leisure travelers facing missed connections and compounding gate delays.
Multi-Hub Breakdown: Weather, Congestion, and Critical Equipment Outages
The operational breakdown was not isolated to a single localized front; rather, distinct operational constraints triggered cascading delays across disparate geographic quadrants:
- Boston Logan (BOS): Endured the highest disruption volume in the country, with 25% of departing flights and 36% of arriving flights delayed, alongside a 2% cancellation rate across both directions. The FAA instituted a formal ground delay program citing low cloud ceilings, stretching average arrival waits to 75 minutes.
- New York LaGuardia (LGA): Logged 252 delays and six cancellations, with departure delays hitting 25% and arrival delays reaching 22% due to tight runway slot metering.
- San Diego International (SAN): Processed 277 delays and three cancellations, where arriving flight delays climbed to 34% as the FAA imposed a volume-based ground delay program averaging 58 minutes.
- Raleigh-Durham International (RDU): Recorded 169 delays and nine cancellations (28% departure and 26% arrival delay rates). The airport experienced the day's steepest individual holding delay—averaging 115 minutes—triggered by a ground-side equipment outage.
- Phoenix Sky Harbor (PHX): Registered 180 delays and three cancellations, with severe convective thunderstorms forcing the FAA to issue a full ground stop that grounded arriving aircraft at their departure gates nationwide.
- Austin-Bergstrom International (AUS): Reported 57 delays and one cancellation after localized high winds triggered an emergency ground stop.
- Los Angeles (LAX) and South Florida: LAX logged 139 delays and 11 cancellations (6% departure, 9% arrival delays), while Fort Lauderdale (FLL) posted 93 delays and five cancellations, with departure delays surging to 19%.
In the New York metropolitan area, the congestion extended beyond LaGuardia. John F. Kennedy International (JFK) recorded 121 delays and eight cancellations (7% departure, 11% arrival delays), while Newark Liberty (EWR) posted 92 delays and seven cancellations (7% departure, 8% arrival delays), creating intense regional airspace friction.
Carrier Performance Breakdown: Point-to-Point vs. Hub-and-Spoke Exposure
The operational impact varied heavily depending on airline network design. Southwest Airlines, which operates a high-frequency point-to-point network, suffered the greatest absolute delay volume, accumulating 664 delayed flights alongside nine cancellations. When aircraft rotate through multiple cities without long scheduled ground buffers, a morning ground stop in Phoenix or Austin instantly infects afternoon flights in Chicago, Denver, and Baltimore.
Among legacy hub-and-spoke carriers, United Airlines recorded the highest cancellation total with 25 grounded flights (and 245 delays, representing 7% of its schedule). Delta Air Lines logged 337 delays (9% of its flights) and eight cancellations. JetBlue Airways suffered the highest proportional delay rate among major carriers, with 212 flights delayed—representing a notable 22% of its entire operation—alongside 20 cancellations (2% cancellation rate), heavily driven by its heavy fleet concentration at Boston Logan and New York gateways. Regional carrier SkyWest Airlines logged 179 delays (6%) and 12 cancellations, illustrating the upstream drag on feeder services.
The comparative metrics across affected hubs and airlines are detailed in the operational performance table below:
| Aviation Entity | Primary Nature of Operational Disruption | Delays Logged | Cancellations Logged | Key Operational Metric / FAA Program |
|---|---|---|---|---|
| Boston Logan (BOS) | Low cloud ceilings & terminal congestion | 433 | 37 | FAA ground delay program; 75-min average delay |
| New York LaGuardia (LGA) | Runway slot restrictions & airspace holding | 252 | 6 | 25% departure delay rate / 22% arrival delay rate |
| San Diego Intl (SAN) | Terminal capacity & flight volume overload | 277 | 3 | FAA ground delay program; 58-min average delay |
| Raleigh-Durham (RDU) | Critical equipment and system outage | 169 | 9 | FAA ground delay advisory; 115-min average delay |
| Phoenix Sky Harbor (PHX) | Convective thunderstorm cells | 180 | 3 | Full FAA ground stop enacted |
| Los Angeles Intl (LAX) | Downstream coastal flow control | 139 | 11 | 9% arrival delay rate; transcontinental slippage |
| John F. Kennedy (JFK) | Metropolitan airspace congestion | 121 | 8 | 11% arrival delay rate |
| Fort Lauderdale (FLL) | Regional convective weather & scheduling drag | 93 | 5 | 19% departure delay rate |
| Newark Liberty (EWR) | Runway metering & regional coordination | 92 | 7 | 8% arrival delay rate |
| Austin-Bergstrom (AUS) | Surface wind shear & turbulence | 57 | 1 | Full FAA wind ground stop enacted |
| Southwest Airlines (WN) | Point-to-point rotational propagation | 664 | 9 | Highest total carrier delay volume nationwide |
| Delta Air Lines (DL) | Hub transit delays (Northeast / West Coast) | 337 | 8 | 9% of total scheduled network delayed |
| United Airlines (UA) | Hub scheduling adjustments | 245 | 25 | Highest cancellation total among major carriers |
| JetBlue Airways (B6) | Heavy Northeast base exposure (BOS/JFK) | 212 | 20 | 22% delay rate; severe regional network strain |
| SkyWest Airlines (OO) | Regional feeder partner disruptions | 179 | 12 | 6% network delay rate across regional routes |
Expert Analysis: Rotational Fragility and Regulatory Passenger Rights
For passengers flying across the United States, the direct consequence of over 3,200 midday delays is a breakdown of evening bank connectivity. In modern airline scheduling, turn times between domestic flight legs are compressed to 40–55 minutes to maximize asset efficiency. When the FAA institutes a 75-minute ground delay at Boston or a 115-minute delay at Raleigh-Durham, inbound aircraft automatically miss their scheduled departure windows for subsequent legs.
The operational pressure this creates means that even passengers departing sunny airports like Los Angeles or Fort Lauderdale face hours of tarmac delays because their inbound aircraft or flight crews are stranded in Boston or New York. When flight crews reach their federally mandated duty limits governed by Part 117 of FAA regulations, flights that were initially delayed by 30 minutes are abruptly cancelled late at night due to lack of legal crew availability.
From a regulatory standpoint, travelers must navigate the rules enforced by the U.S. Department of Transportation (DOT):
- Controllable vs. Weather Delays: Disruptions caused by thunderstorms in Phoenix or low ceilings in Boston are legally categorized as uncontrollable weather events. Under DOT guidelines, airlines are not legally mandated to provide complimentary hotel accommodations or meals for weather-induced delays, though individual carrier customer service commitments vary.
- Equipment Outage Exceptions: The equipment outage that delayed Raleigh-Durham flights by an average of 115 minutes falls into a grey area. If the failure stems from an airline's internal IT infrastructure rather than FAA air traffic control systems, passengers are entitled to carrier-funded meal vouchers and accommodation under DOT commitments made by major US airlines.
- Refund Entitlements: If an airline cancels a flight or makes a significant schedule change—regardless of whether it was caused by wind, equipment, or air traffic control—passengers who choose not to accept the alternative itinerary are entitled to a full cash refund to the original form of payment, not merely an expiring travel credit.
Key Takeaways
- Widespread US Disruptions: 3,235 flight delays and 143 cancellations disrupted domestic travel across major US hubs on 12 October 2026.
- Boston Logan Hardest Hit: Boston Logan topped nationwide airport disruptions with 433 delays, 37 cancellations, and an FAA ground delay averaging 75 minutes.
- Southwest Leads Airline Delays: Southwest Airlines registered 664 delayed flights, while United logged the highest cancellation total with 25 flights grounded.
- FAA Interventions Enacted: Ground stops and ground delay programs were enacted across Phoenix (thunderstorms), Austin (wind), San Diego (volume), and Raleigh-Durham (equipment outage).
- JetBlue Network Strain: JetBlue suffered a 22% operational delay rate, reflecting its heavy exposure to congested Northeast corridors.
FAQ: US Flight Delays and Cancellations October 2026
What caused the widespread flight disruptions across US airports on 12 October 2026?
Disruptions were caused by a combination of low cloud ceilings in Boston, severe thunderstorms in Phoenix, high winds in Austin, an equipment outage in Raleigh-Durham, and terminal airspace congestion in San Diego and New York.
Are airlines required to pay for hotels during weather-related flight delays?
No. Under US Department of Transportation rules, airlines are exempt from mandatory hotel and meal compensation when delays or cancellations stem from uncontrollable weather events or air traffic control directives.
Which airline experienced the highest delay count?
Southwest Airlines recorded the highest delay count in the United States with 664 delayed flights, driven by point-to-point aircraft rotational delays.
What should travelers do if their connecting flight is threatened by a ground delay?
Monitor airline apps for proactive rebooking waivers, contact customer service via chat or telephone immediately, and ask agents to protect seats on alternative routing banks before landing.
When cascading ground delays choke critical hub corridors, the fragile choreography of domestic aviation leaves passenger schedules entirely at the mercy of aircraft rotation buffers.
Related Travel Guides
Disclaimer
This article is for informational and educational purposes only. It does not constitute legal, financial, or professional advice. While we strive to provide accurate and up-to-date information, travel policies, regulations, and conditions change rapidly. Always verify information with official sources before making travel decisions. Nomad Lawyer makes no representations about the accuracy, reliability, completeness, or suitability of the information provided. Readers should consult qualified professionals for advice specific to their circumstances. The views expressed in this article are those of the author and do not necessarily reflect the views of Nomad Lawyer.
Kunal K Choudhary
Co-Founder & Contributor
A passionate traveller and tech enthusiast. Kunal contributes to the vision and growth of Nomad Lawyer, bringing fresh perspectives and driving the community forward.
Learn more about our team →