
New Zealand International Visitor Survey June 2026 Reveals Spend Reaches NZ$4,537 Per Visit as Australian and US Travel Surges
New Zealand's IVS June 2026 report reveals average international visitor spend rose 10.2% to NZ$4,537, with total dining spend hitting NZ$2.07B.

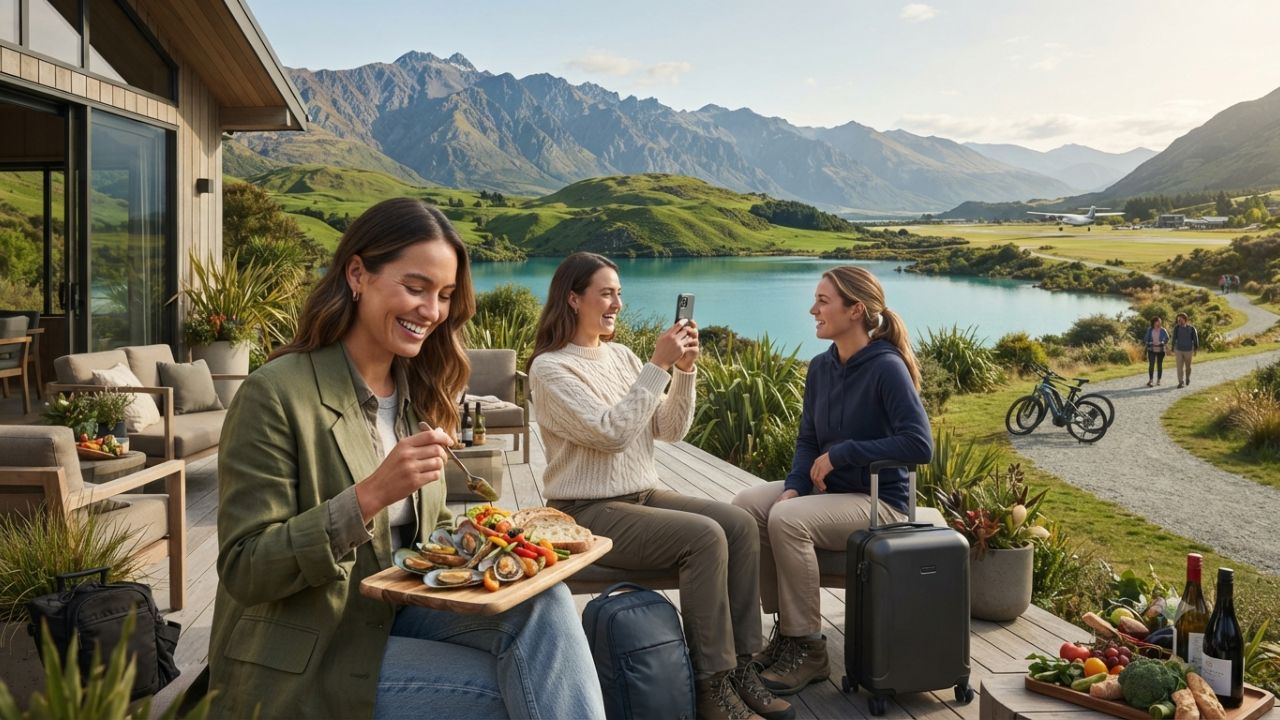
Image generated by AI
International visitor spending across Aotearoa New Zealand experienced strong growth for the year ending June 2026, with average expenditure per visitor rising 10.2 percent year-on-year to NZ$4,537. Official International Visitor Survey (IVS) data released by Tourism New Zealand shows major growth across priority markets, positioning the nation to reach its long-term targets of 3.9 million annual arrivals and NZ$14.4 billion in total export revenue by June 2027.
Tourism New Zealand Reports 10.2 Percent Surge in Average Visitor Expenditure
Data monitored by the Ministry of Business, Innovation and Employment (MBIE New Zealand) demonstrates that international tourism remains one of the country's primary export earners, generating high yield across regional accommodation, food services, transport networks, and attraction operators.
Commenting on the IVS results, Tourism New Zealand Chief Executive René de Monchy stated that the strategy of prioritizing high-value experiences over sheer visitor numbers is generating sustainable economic benefits across regional communities. A survey evaluation conducted by Stats NZ confirmed that 91.3 percent of international visitors reported their New Zealand trip met or exceeded expectations.
A global consideration pool of 183 million potential travelers, combined with a projected 5 percent increase in international airline seat capacity over the next six months, provides strong momentum for the upcoming spring and summer travel seasons.
June 2026 International Visitor Survey Performance Matrix
| Metric / Market | Year Ending June 2026 Result | Year-on-Year Growth | Strategic Milestone & Sector Impact |
|---|---|---|---|
| Average Spend Per Visit | NZ$4,537 | +10.2% YoY Increase | Shift toward longer stays & premium experience bookings |
| Australia Source Market | NZ$4.4 Billion | +25% YoY Growth | Largest trans-Tasman visitor export contribution |
| United States Source Market | NZ$2.2 Billion | +20% YoY Growth | Strong long-haul demand for active outdoor escapes |
| China Source Market | NZ$1.5 Billion | +26% YoY Growth | Recovery in independent & premium group travel |
| Dining & Culinary Spend | NZ$2.07 Billion | Significant Expansion | 84% of potential visitors seek authentic local dining |
| Overall Visitor Satisfaction | 91.3% Satisfaction | Sustained High Benchmark | Visitors stating trip met or exceeded expectations |
| Target Goals (June 2027) | 3.9M Visitors / NZ$14.4B | Projected Milestone | National strategic export target |
Market-Specific Spend Growth, Dining Revenue, and Māori Tourism Integration
The IVS report underscores rapid expenditure increases across New Zealand's top source markets. The top 15 priority markets currently generate 85 percent of the nation's total international visitor value. Australia led all source markets with NZ$4.4 billion (+25%), followed by the United States at NZ$2.2 billion (+20%) and China at NZ$1.5 billion (+26%).
Gastronomy has emerged as a major revenue driver, with international travelers spending NZ$2.07 billion on food and beverage experiences. Market research shows that 84 percent of prospective travelers express a strong desire to experience local New Zealand cuisine, a trend further bolstered by the introduction of the MICHELIN Guide.
Furthermore, Tourism New Zealand's international marketing campaigns focus on three core travel pillars:
- Active Escapes: Promoting cycling, alpine walking, and national park exploration.
- Wellness & Culture: Integrating wellness experiences guided by te ao Māori (Māori worldview) perspectives.
- Culinary Journeys: Highlighting farm-to-table dining, regional wineries, and ocean-fresh seafood.
Traveler Logistics Guide: Planning a High-Value Itinerary in New Zealand
Travelers planning an itinerary to New Zealand can optimize their entry procedures and regional transportation using official travel guidelines.
Entry Requirements and NZeTA Digital Clearance
- NZeTA and IVL: Travelers from 60 visa-waiver countries (including the US, Canada, UK, EU nations, and Japan) must request an official New Zealand Electronic Travel Authority (NZeTA) online prior to departure. The process includes paying the International Visitor Conservation and Tourism Levy (IVL).
- Australian Citizens & Residents: Australian passport holders do not require an NZeTA or visa to enter New Zealand.
Regional Transit and Domestic Connectivity
- Self-Drive and Campervan Rentals: For travelers exploring both the North and South Islands, reserving ferry crossings across the Cook Strait (Interislander or Bluebridge ferries between Wellington and Picton) 3 to 6 months in advance is essential during peak summer months (December–February).
- Air Connectivity: Domestic air links connecting Auckland (AKL), Wellington (WLG), Christchurch (CHC), and Queenstown (ZQN) provide efficient transit between key regional hubs.
Strategic Logistics Analysis and 2026 Traveler Insights
The surge in average expenditure to NZ$4,537 reflects a fundamental shift in the New Zealand tourism landscape: a transition from budget-centric backpacking toward "high-value" experiential travel. For the 2026/2027 season, travelers should anticipate a more premiumized infrastructure, particularly in regional hubs where luxury eco-lodges and boutique culinary experiences are expanding to meet the demand from US and Chinese markets.
Peak Timing and Seasonal Planning While the traditional peak remains the austral summer (December through February), the data suggests a growing trend toward "shoulder season" travel. To avoid the congestion associated with the projected 5% increase in airline capacity, visitors should target the autumn window (March to May) or the spring window (September to November). These periods offer stable weather for outdoor activities—critical for the "active outdoor escapes" favored by US travelers—while avoiding the premium pricing of the December peak.
Booking and Logistics Considerations With a strategic focus on high-yield tourism, availability for premium accommodation and guided excursions is tightening. It is recommended that travelers secure bookings for "bucket-list" experiences—such as Milford Sound cruises or luxury lodges in Central Otago—at least six months in advance. Furthermore, the rise in spend is partially attributed to longer average stays; visitors should prioritize "slow travel" itineraries that allocate more time to secondary regions like Taranaki or the East Coast to avoid the bottlenecks of the main tourist trail.
Transit Alternatives and Regional Connectivity While rental cars remain the primary mode of transport, the 2026 landscape emphasizes sustainable transit. Travelers should explore the expanding network of electric vehicle (EV) charging infrastructure, which has seen significant investment to support the high-value visitor segment. For those avoiding driving, premium coach services and regional flight hops provide efficient alternatives, though pre-booking is essential during the summer surge.
Regional Context The growth in dining and culinary spend (NZ$2.07 billion) indicates that gastronomy has become a primary travel motivator. Visitors should look beyond urban centers to regional "food trails," particularly in Marlborough and Hawke's Bay, where the integration of farm-to-table dining and viticulture is driving the current expenditure spike.
Frequently Asked Questions
What was the average international visitor spend in New Zealand for the year ending June 2026?
Average international visitor spend reached NZ$4,537 per visit, representing a 10.2 percent year-on-year increase.
What are Tourism New Zealand's targets for June 2027?
Tourism New Zealand aims to reach 3.9 million international visitors and NZ$14.4 billion in visitor spending by June 2027.
How much did international tourists spend on food and dining in New Zealand?
International visitors spent NZ$2.07 billion on food and beverage experiences during the year ending June 2026.
Related Travel Guides
New Zealand Travel Boom Overseas Visitors Beat Pre-Covid Records
Auckland Airport Car and Campervan Rental Guide
10 Best South Island Scenic Drives in New Zealand, According to Reddit
Disclaimer
This article is for informational and educational purposes only. It does not constitute legal, financial, or professional advice. While we strive to provide accurate and up-to-date information, travel policies, regulations, and conditions change rapidly. Always verify information with official sources before making travel decisions. Nomad Lawyer makes no representations about the accuracy, reliability, completeness, or suitability of the information provided. Readers should consult qualified professionals for advice specific to their circumstances. The views expressed in this article are those of the author and do not necessarily reflect the views of Nomad Lawyer.
Kunal K Choudhary
Co-Founder & Contributor
A passionate traveller and tech enthusiast. Kunal contributes to the vision and growth of Nomad Lawyer, bringing fresh perspectives and driving the community forward.
Learn more about our team →