World Cup 2026 Drives US Tourism Beyond Stadiums: 73% Fan Dispersal, RevPAR Spikes, and the 100-Million Visitor Goal
With 73% of foreign fans traveling into 1,000+ counties, the 2026 FIFA World Cup reshaped US tourism spending and accelerated 2030 travel expansion targets.

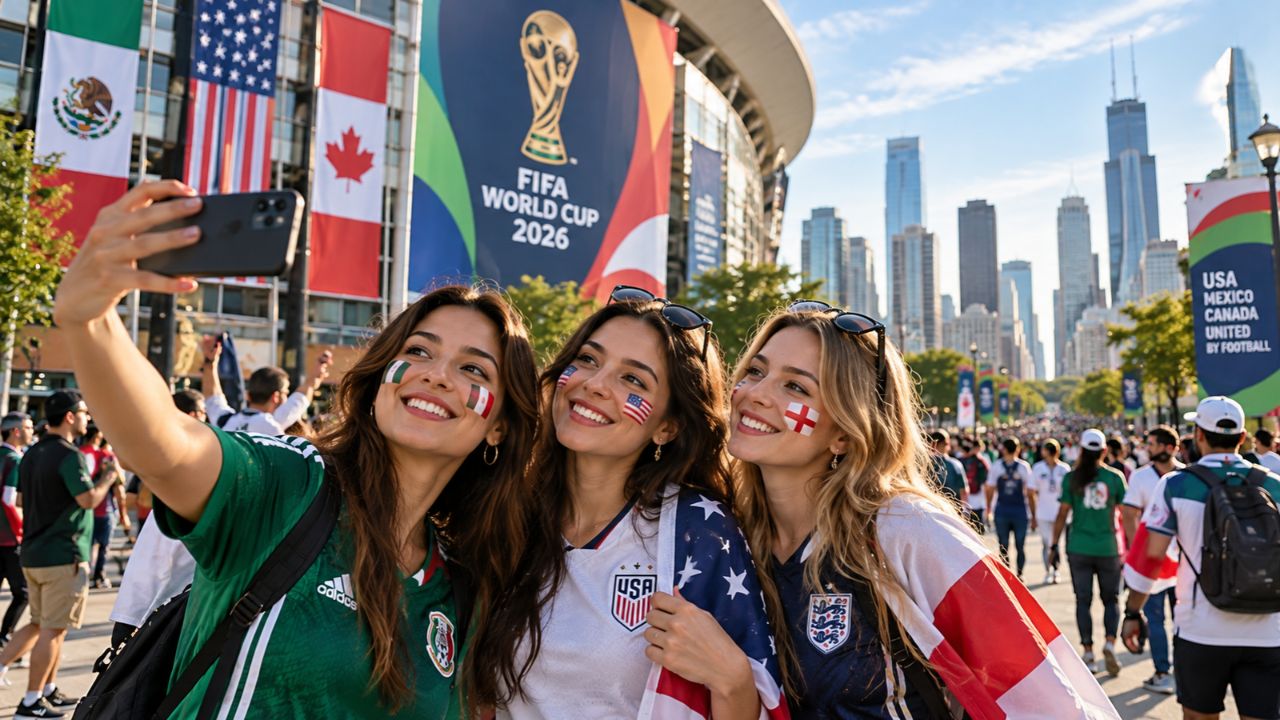
Image generated by AI
A striking 73% of international soccer fans visiting the United States for the 2026 FIFA World Cup traveled beyond their primary match locations, channeling visitor spending into more than 1,000 American counties. While the tournament staging centered around 11 metropolitan areas across the United States, the geographic distribution of foreign travelers extended far beyond stadium perimeters. This dispersal introduced rural municipalities, independent lodging establishments, and regional cultural centers to high-spending international travelers who historically concentrated their journeys exclusively in traditional gateways like New York, Orlando, or Las Vegas.
The broad circulation of overseas visitors has transformed the commercial rationale of hosting mega-sporting events. Rather than creating isolated economic bubbles inside arena districts, the tournament functioned as an extended travel corridor. Foreign supporters from Mexico, Canada, the United Kingdom, India, and Japan utilized secondary rail links, domestic air routes, and highway networks, driving out-of-region destination spending 10% above baseline metrics.
Geographic Dispersal: How Match Venues Unlocked Over 1,000 American Counties
The 2026 tournament, jointly organized by the United States, Mexico, and Canada, demonstrated that large-scale sporting championships can decentralize visitor economies when mobility infrastructure supports regional transit. Research published on 18 September 2026 by the U.S. Travel Association indicates that fans incorporated multi-destination road itineraries, national park excursions, and heritage tours into their match schedules.
This geographic diffusion proved beneficial for small merchants, boutique regional operators, and municipal attractions. Travelers ventured into surrounding counties between group-stage matches and knockout rounds, frequenting independent dining establishments, regional museums, and retail districts. Crucially, the arrival of foreign travelers generated positive cultural sentiment across host communities. According to survey data from the U.S. Travel Association, 86% of surveyed Americans expressed genuine happiness upon observing overseas visitors exploring their local areas, while 81% reported a heightened sense of national pride.
Beyond transient match-day spending, social sharing by visiting supporters acted as organic destination marketing. By showcasing small-town culinary scenes, regional wildlife parks, and historic downtowns to international networks, overseas visitors created extended awareness that municipal tourism boards rarely possess the promotional capital to generate independently.
Economic Performance Indicators and Regional Tourism Metrics
While match venues experienced predictable spikes in demand, official economic indicators reveal a complex, bifurcated operating environment across the broader hospitality sector. Hospitality performance across the 11 American host markets surged during operational windows, driven by international arrivals and domestic supporters following national squads coordinated through FIFA.
Hotel revenue per available room (RevPAR) expanded by 17.8% across the 11 host markets throughout the competition period, escalating to an intense 35.2% RevPAR increase on actual match days as dynamic lodging rates peaked. International arrivals into direct host metropolitan areas recorded a modest 0.7% uptick during the tournament timeframe.
| Tournament Metric / Performance Indicator | Recorded Figure | Data Source / Measurement Standard |
|---|---|---|
| US Host Metropolitan Hubs | 11 Host Regions | Official 2026 Tournament Allocation |
| American Counties Reached by Fans | More than 1,000 Counties | U.S. Travel Association Research (Sept 2026) |
| Fans Traveling Beyond Primary Venue | 73% of International Attendees | Out-of-market itinerary tracking |
| Out-of-Region Destination Spending | +10% Above Baseline | Measured against research baseline |
| Host Market Hotel RevPAR Growth | +17.8% (Overall Tournament) | Baseline comparison across 11 cities |
| Match-Day Hotel RevPAR Growth | +35.2% (Game Days Only) | Host market lodging tariff spikes |
| Host City Inbound Travel Growth | +0.7% Expansion | Inbound international flight monitoring |
| July 2026 US International Arrivals | 6,248,242 Visitors | National Travel and Tourism Office (NTTO) |
| Leading Inbound Origin Markets | Mexico, Canada, UK, India, Japan | NTTO July 2026 Arrivals Registry |
| Industry 2030 Inbound Target | 100 Million Visitors Annually | U.S. Travel Association White House Proposal |
| Federal Government 2030 Baseline | 85.2 Million Visitors Annually | US Department of Commerce Official Forecast |
| Projected Economic Yield at 100M Target | $81 Billion & 400,000+ Jobs | U.S. Travel Association Economic Modeling |
Despite regional hotel windfalls, nationwide top-line numbers reflected macroeconomic crosswinds. Data from the National Travel and Tourism Office (NTTO) documented 6,248,242 international arrivals in July 2026, marking a fractional year-over-year decline compared to July 2025. Mexico retained its status as the primary foreign arrival source, followed by Canada and the United Kingdom, with India and Japan maintaining strong volume. This contrast underlines that while mega-events generate intense localized revenue surges and regional dispersal, they do not automatically trigger uniform nationwide tourism expansion.
Expert Analysis: The 100-Million Visitor Ambition Versus Consular and Border Reality
The commercial momentum generated by the World Cup has prompted the American travel sector to lobby for aggressive structural growth. Following a high-level White House consultation with President Donald Trump, U.S. Travel Association President and CEO Geoff Freeman proposed an ambitious national target: expanding annual foreign arrivals to 100 million international visitors by 2030. Economic modeling from the trade group projects that hitting this milestone would inject $81 billion in additional direct tourist spending and create over 400,000 domestic jobs.
For travelers booking journeys to the United States, the direct consequence of this growth strategy is an escalating push to modernize entry infrastructure and reduce administrative friction. However, a significant gap separates commercial aspirations from official federal projections. The US Department of Commerce currently forecasts 85.2 million international arrivals in 2030. Bridging the nearly 15-million-visitor deficit requires resolving structural impediments that frequently discourage prospective travelers from non-visa-waiver nations.
The pricing and logistical pressure this creates centers on consular operations and airport processing capacity. Travelers originating in high-growth inbound corridors such as India, Colombia, and Brazil continue to confront extended appointment backlogs for B1/B2 tourist visas, alongside escalating application fees. Furthermore, security checkpoint throughput at major transatlantic and transpacific hubs must scale rapidly if the nation hopes to absorb successive international gatherings.
The United States stands on the threshold of an unprecedented decadelong sports calendar: Los Angeles will host the Summer Olympic and Paralympic Games in 2028, followed by the Men’s Rugby World Cup in 2031 and the Salt Lake City Winter Olympics in Utah in 2034. If federal authorities fail to reform visa appointment systems, streamline biometric border clearance, and address airfare inflation, international travelers may divert discretionary holiday spending toward less restrictive global markets, blunting the long-term legacy of the 2026 tournament.
Key Takeaways
- Unprecedented Regional Dispersal: Nearly three-quarters (73%) of international World Cup fans journeyed beyond match stadiums, injecting revenue into more than 1,000 American counties.
- Intense Match-Day Lodging Rates: Average hotel revenue per available room (RevPAR) jumped 17.8% across the 11 host markets, soaring by 35.2% on actual match days.
- Mixed National Arrival Trends: The National Travel and Tourism Office logged 6,248,242 overseas arrivals in July 2026, demonstrating that localized tournament booms occurred alongside flat national arrival trends.
- The 100-Million Arrival Target: Industry leaders have pitched a target of 100 million annual foreign tourists by 2030, requiring nearly 15 million more arrivals than the Commerce Department’s 85.2 million baseline projection.
- Decade of Global Sporting Showcases: The commercial viability of the 2030 goal hinges on resolving consular visa delays and port-of-entry bottlenecks before the 2028 Los Angeles Olympics and the 2031 Rugby World Cup.
FAQ: US World Cup Tourism Expansion 2026
How many US counties saw tourist activity from the 2026 World Cup?
More than 1,000 American counties welcomed international travelers during the tournament, as 73% of foreign attendees explored communities outside their main match cities.
Which countries sent the highest number of visitors to the US in July 2026?
According to official National Travel and Tourism Office data, Mexico led all international inbound markets in July 2026, followed closely by Canada, the United Kingdom, India, and Japan.
How much did hotel revenues increase in the 11 World Cup host markets?
Hotel RevPAR rose by an average of 17.8% across the 11 host markets during the tournament period, with match days experiencing an average rate spike of 35.2%.
What is the economic objective of the proposed 2030 US travel expansion?
The U.S. Travel Association's 100-million visitor goal seeks to generate an additional $81 billion in annual travel spending and support over 400,000 American jobs by 2030.
Converting a temporary tournament influx into a sustained travel renaissance requires dismantling border friction before the Olympic torch arrives in 2028.
Related Travel Guides
United States International Tourism Arrivals July 2026: Regional Market Trends and Inbound Shifts
Americas Transit Shift 2026: Cross-Border Leisure and Business Travel Across US, Mexico, and Canada
10 Best Small Towns to Visit in America According to Reddit 2026
Disclaimer
This article is for informational and educational purposes only. It does not constitute legal, financial, or professional advice. While we strive to provide accurate and up-to-date information, travel policies, regulations, and conditions change rapidly. Always verify information with official sources before making travel decisions. Nomad Lawyer makes no representations about the accuracy, reliability, completeness, or suitability of the information provided. Readers should consult qualified professionals for advice specific to their circumstances. The views expressed in this article are those of the author and do not necessarily reflect the views of Nomad Lawyer.
Naina Thakur
Contributor & Travel Specialist
Travel enthusiast and legal writer covering visa regulations, responsible tourism, and cultural journeys across global destinations.
Learn more about our team →