
US Tourism Confronts 9.9 Million Trip Drop as Canadian Travelers Shift Overseas in 2026
California, New York, Florida, and northern border states face economic pressure as 9.9 million fewer Canadian visitors travel south to the United States.

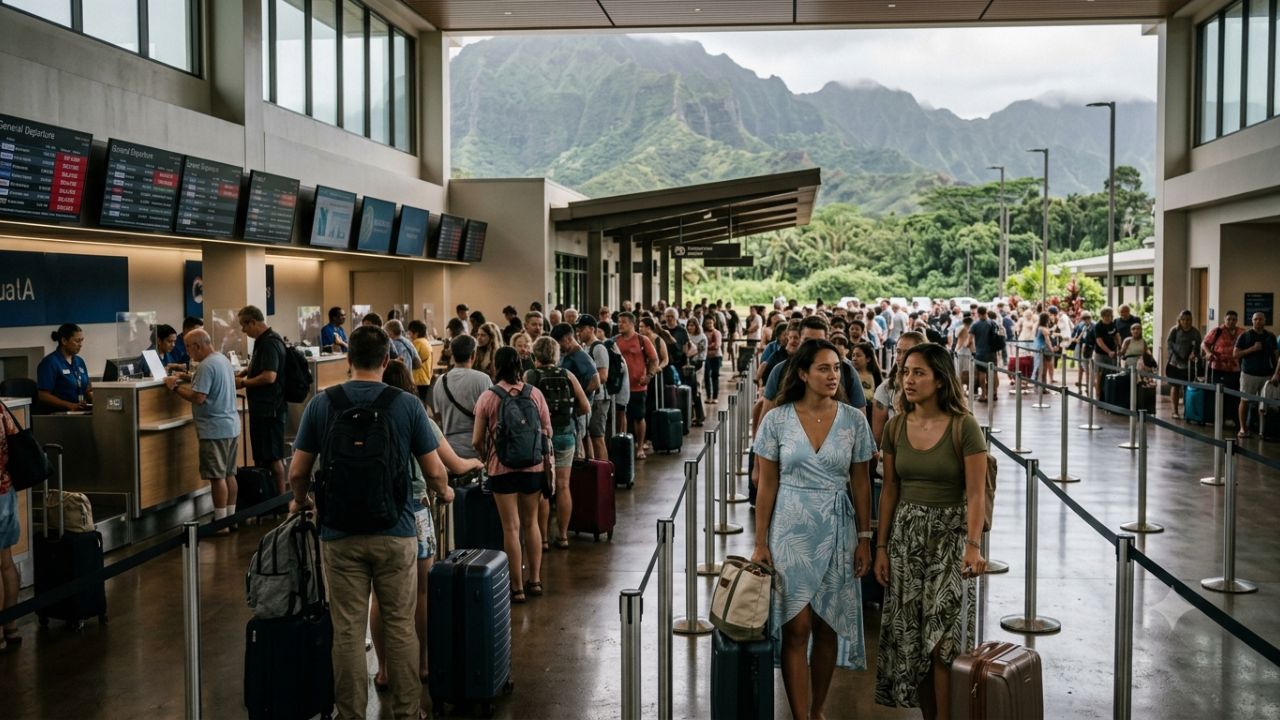
Image generated by AI
WASHINGTON, D.C. — American tourism hubs are confronting a sharp reduction in Canadian cross-border travel in 2026, as nearly 9.9 million fewer visitors from Canada entered the United States over a 12-month period, diverting an estimated $2.3 billion in travel spending to overseas destinations.
The downturn marks a 25% contraction in America’s largest international market, falling from 39 million Canadian trips in 2024 to 29.1 million in 2025. This structural shift is reverberating across traditional sunbelt snowbird havens in California and Florida while depressing retail, hotel, and cross-border commercial activity in northern states including New York, Michigan, Vermont, North Dakota, Alaska, and Washington.
Canadian Outbound Travel Shifts Away From US Destinations
Official tourism data reveals that the drop in Canadian travel to the United States is not a symptom of reduced travel demand overall. While Canadian visitor spending inside the United States decreased by approximately $2.3 billion, Canadian international travel expenditures in overseas markets simultaneously surged by roughly $2.5 billion.
This inverse spending pattern indicates that Canadian vacationers are actively redirecting travel budgets to alternative international destinations, domestic Canadian trips, and Caribbean resorts. On average, the decline represents an extraordinary daily drop of approximately 27,000 fewer Canadian travelers crossing into American territory.
California Snowbird and Leisure Market Faces Prolonged Softness
California entered 2026 struggling to rebuild its Canadian visitor footprint after Visit California registered a steep 20.1% decline in Canadian arrivals during 2025, bringing annual visitation down to 1.4 million. Baseline projections anticipated a modest 2.6% recovery in 2026, but risk models warn of a potential 6.1% secondary contraction if unfavorable economic and exchange rate conditions persist.
International flight arrival metrics confirm that recovery remains fragile across West Coast entry points. In July 2026, approximately 69,522 Canadian passengers arrived by air through California ports of entry, reflecting a 2.3% decrease compared to the same month a year earlier.
| California Tourism Indicator | Statistical Metric |
|---|---|
| Canadian Visitation Change (2025) | -20.1% |
| Total Canadian Visitors (2025) | 1.4 million |
| Baseline 2026 Forecast | +2.6% |
| Downside 2026 Forecast Scenario | -6.1% |
| Canadian Air Arrivals (July 2026) | 69,522 |
| Year-over-Year Air Arrival Change (July 2026) | -2.3% |
The decline threatens multiple economic sectors in major metropolitan hubs. Canadian travelers to Los Angeles, San Francisco, San Diego, and Palm Springs represent high-spending vacationers, convention delegates, and extended winter residents whose absence directly impacts hotel occupancy, dining, retail, and regional airline revenue.
New York Cross-Border Shopping and Hotel Bookings Contract
New York State is absorbing economic losses across two distinct travel fronts. Urban hospitality providers in New York City report Canadian booking drops reaching up to 40% during period troughs, with overall statewide Canadian visitation falling by more than 26%.
Simultaneously, border communities in Western New York—including Buffalo and Niagara Falls—are experiencing a drop in day-trip shoppers from Ontario. Local retail merchants in border corridors report revenue dips of up to 20% as high-frequency Canadian visitors curtail short weekend stays and regional shopping excursions.
| New York Tourism Indicator | Statistical Metric |
|---|---|
| Statewide Canadian Visitor Decline | Exceeding 26% |
| NYC Canadian Hotel Booking Drop | Up to 40% |
| Border Area Retail Decline | Up to 20% |
| Primary Canadian Source Market | Ontario |
| Primary Affected Destinations | Buffalo, Niagara Falls, New York City |
| Destination Recovery Strategy | Ontario-Targeted Travel Promotions |
Because Ontario residents living near the international boundary historically make multiple trips per year, losing repeat drive-market visitors severely compresses cash flow for border hotels, restaurants, and regional retail outlets.
Florida Loses 270,000 Canadian Visitors in First Half of 2026
Florida's seasonal snowbird economy continues to register significant losses through mid-2026. Data covering the first six months of 2026 shows approximately 1.68 million Canadian arrivals in Florida, representing a direct loss of 270,000 Canadian visitors compared to the same period in 2025—a 13.9% year-over-year contraction.
Overall visitor volume to Florida contracted by 1.4% to 73.5 million visitors in the first half of 2026. Crucially, Canadian arrival figures remain approximately 610,000 visitors below pre-pandemic 2019 benchmarks, presenting a persistent deficit for Florida's winter residency sector.
| Florida Tourism Indicator | Statistical Metric |
|---|---|
| Canadian Visitors (H1 2026) | 1.68 million |
| Year-over-Year Visitor Loss | 270,000 fewer visitors |
| Canadian Visitor Percentage Change | -13.9% |
| Deficit vs Pre-Pandemic H1 2019 | 610,000 fewer visitors |
| Total Statewide Visitors (H1 2026) | 73.5 million |
| Total Visitor Volume Change | -1.4% |
Long-stay Canadian snowbirds typically generate substantial economic multipliers across Florida. Unlike short-term vacationers who spend for a few nights, winter residents rent properties for months, purchase groceries, visit golf courses, and patronize local services throughout the season.
South Carolina Grand Strand Observes Sharp Drive-Market Pullback
In South Carolina, regional travel hubs along the Grand Strand report significant declines in drive-market Canadian visitors. Coastal destinations such as Myrtle Beach, which rely on long-distance road trips from Quebec and Ontario during winter months, have recorded local traffic drops of up to 65.4% during specific downturn periods.
| South Carolina Tourism Indicator | Statistical Metric |
|---|---|
| Myrtle Beach Canadian Traffic Drop | Up to 65.4% (Local indicator) |
| National US Trips Lost by Canadians | 9.9 million |
| National Market Contraction | Approximately 25% |
| Primary Exposed Region | Myrtle Beach & The Grand Strand |
| Target Visitor Segment | Long-stay & Road-Trip Canadians |
While local traffic indices vary, the national loss of 9.9 million Canadian trips underscores the operational strain on mid-Atlantic coastal resorts accustomed to Canadian drive-in tourists.
North Dakota Border Crossings Drop 23.9%
Northern border states offer clear empirical metrics detailing the scale of the contraction. North Dakota reported a 23.9% drop in Canadian border crossings during 2025, contributing to an overall 2.6% decline in total statewide visitors to 25.6 million.
Total visitor expenditures in North Dakota dropped 1.2% to $3.4 billion. Although domestic travelers generate 88.4% of total state visitation, Canadian border crossers contribute disproportionately to commercial fuel stops, border retail centers, and regional lodging facilities.
| North Dakota Tourism Indicator | Statistical Metric |
|---|---|
| Canadian Border Crossing Change | -23.9% |
| Total Statewide Visitors | 25.6 million |
| Overall Visitor Decline | -2.6% |
| Total Visitor Expenditures | $3.4 billion |
| Visitor Expenditure Change | -1.2% |
| Domestic Traveler Share | 88.4% |
Early 2026 tracking suggests stabilization in select commercial sectors, but restoring historical Canadian border-crossing volume remains essential for northern border merchants.
Michigan Border Corridors Sensitive to Discretionary Travel Cuts
Michigan's tourism economy maintains deep commercial ties with Ontario, operating major international gateways at Detroit and Port Huron. While statewide 2026 Canadian visitor percentages are still being compiled, local hospitality providers remain highly exposed to national cross-border trends.
| Michigan Tourism Indicator | Statistical Metric |
|---|---|
| National Canadian US Trips (2024) | 39 million |
| National Canadian US Trips (2025) | 29.1 million |
| National Trips Lost | 9.9 million |
| National Contraction Rate | Approximately 25% |
| Primary Source Market | Ontario |
| Key Border Gateways | Detroit & Port Huron |
Because short cross-border road trips are largely discretionary, adverse currency fluctuations and rising living costs prompt immediate cancellations among Canadian shoppers, sports fans, and weekend travelers in Michigan.
Vermont Records 47% Spending Drop Followed by Early 2026 Rebound
Vermont experienced one of the sharpest initial economic shocks in the nation, recording a 47% collapse in Canadian credit card spending during 2025, accompanied by a 46% decline in active Canadian card usage and a 31% drop in return trips.
However, recent 2026 metrics indicate early recovery momentum. Canadian credit card spending in Vermont rose 5% year-to-date through June 2026, highlighted by a notable 26% year-over-year surge in June. Total passenger border crossings reached 1.6 million through July 2026—a 6.6% increase—while July return trips grew 12.8%.
| Vermont Tourism Indicator | Statistical Metric |
|---|---|
| Canadian Card Spending Change (2025) | -47% |
| Canadian Active Cards Used (2025) | -46% |
| Canadian Return Trips (2025) | -31% |
| Year-to-Date Card Spending (thru June 2026) | +5% |
| June 2026 Card Spending Growth | +26% |
| Total Border Crossings (thru July 2026) | 1.6 million (+6.6%) |
| July 2026 Return-Trip Increase | +12.8% |
Vermont’s data demonstrates that while the initial Canadian travel pullback hit border states hard in 2025, aggressive destination marketing can reverse downward trends.
Alaska Highway Tourism Impacted by Canadian Land Arrival Drops
Alaska faces distinct geographical risks due to its physical reliance on Canadian road corridors. Travelers driving between Alaska and the lower 48 states must traverse Canadian territory, while Canadian visitors themselves sustain highway lodging, fuel stations, and excursion operators.
Industry tracking indicates Canadian land arrivals fell by up to 33.9% during specific downturn phases. Sustained reductions in land-based border traffic place severe financial pressure on remote highway communities dependent on summer road-trippers.
| Alaska Tourism Indicator | Statistical Metric |
|---|---|
| Reported Canadian Land Arrival Decline | Around 33.9% (Period-specific indicator) |
| National Canadian Trip Decline | Approximately 25% |
| National Trips Lost | 9.9 million |
| Primary Exposure Sector | Highway & Road-Trip Tourism |
| Affected Businesses | Lodging, Restaurants, Fuel, Tours |
Nevada Resort Sector Uses Currency Discounts to Attract Canadians
Nevada's travel challenge is heavily centered in Las Vegas, where total visitor volume reached 35.46 million between January and November 2025, compared to 38.27 million during the same period a year earlier. This represents a net loss of 2.81 million visitors, or a 7.4% contraction, with November volume dropping 5.2%.
To counter Canadian visitor softness, several Las Vegas hotel-casinos have launched aggressive promotional campaigns, including "Canadian dollar at par" packages designed to eliminate currency conversion penalties for northern guests.
| Nevada & Las Vegas Tourism Indicator | Statistical Metric |
|---|---|
| Las Vegas Visitors (Jan–Nov 2025) | 35.46 million |
| Previous Year Equivalent | 38.27 million |
| Net Visitor Loss | 2.81 million visitors |
| Overall Visitation Change | -7.4% |
| November Volume Change | -5.2% |
| Targeted Promotion Strategy | Canadian Dollar at Par Deals |
Washington Border Businesses Suffer Localized Revenue Drops
Washington State’s proximity to British Columbia makes its northern border towns exceptionally sensitive to Canadian consumer sentiment. Select duty-free merchants and border-dependent retail outlets report business revenue losses exceeding 80% during peak downturn periods.
| Washington Tourism Indicator | Statistical Metric |
|---|---|
| Border Business Revenue Loss | More than 80% (Localized merchant data) |
| National Canadian Contraction | Approximately 25% |
| National Trips Lost | 9.9 million |
| Primary Source Province | British Columbia |
| Primary Exposure Sector | Border Shopping & Short Road Trips |
Multi-State Canadian Tourism Performance Summary
| State / Destination | Key Canadian Tourism Indicator | Reported Statistical Metric |
|---|---|---|
| California | Canadian Visitation (2025) | -20.1% |
| California | Air Arrivals (July 2026) | -2.3% |
| New York | Statewide Canadian Visitors | Exceeding -26% |
| New York City | NYC Hotel Bookings | Up to -40% |
| Florida | Canadian Arrivals (H1 2026) | -13.9% (-270,000 visitors) |
| South Carolina | Myrtle Beach Traffic | Up to -65.4% |
| North Dakota | Border Crossings (2025) | -23.9% |
| Vermont | Card Spending (2025 vs June 2026 YTD) | -47% (2025) / +5% (2026 YTD) |
| Alaska | Canadian Land Arrivals | Around -33.9% |
| Nevada (Las Vegas) | Total Visitors (Jan–Nov 2025) | -7.4% (-2.81 million visitors) |
| Washington | Border Merchant Revenue | More than -80% |
| United States (National) | Canadian US Trips (2024 to 2025) | -25% (9.9 million trips lost) |
| United States (National) | US Expenditures / Overseas Shift | -$2.3 Billion US / +$2.5 Billion Overseas |
Why This Matters: Practical Impact on US Travel Infrastructure
For the traveler and hospitality operator, the structural shift in Canadian travel behavior marks a fundamental realignment in North American tourism flows.
From an economic perspective, the loss of Canadian visitors cannot be measured solely by hotel room nights. Extended-stay snowbirds provide essential seasonal cash flow to RV parks, grocery chains, golf courses, and regional healthcare services across sunbelt states. When Canadian travel shifts to international destinations or domestic Canadian routes, local resort economies face prolonged budget deficits.
For border communities in states like New York, Vermont, North Dakota, and Washington, high-frequency cross-border shopping trips represent the financial lifeblood of regional small businesses. Destination marketing organizations are responding by adjusting pricing models, expanding currency incentives, and targeted promotional campaigns to restore visitor confidence.
FAQ: US Canadian Tourism Downturn (2026)
How many Canadian trips to the US were lost between 2024 and 2025?
Canadian trips to the United States dropped from approximately 39 million in 2024 to 29.1 million in 2025, representing a net loss of nearly 9.9 million trips, or a 25% reduction.
Did Canadians stop traveling entirely, or are they visiting other destinations?
Canadian spending in the US fell by $2.3 billion while Canadian spending on overseas travel increased by $2.5 billion, indicating that travelers redirected their budgets to international destinations rather than canceling travel plans.
Which US states have been most affected by the Canadian visitor drop?
California (-20.1%), Florida (-13.9% in H1 2026), New York (>26%), North Dakota (-23.9% border crossings), and Vermont (-47% spending in 2025) have recorded some of the most significant contractions.
What strategies are US destinations using to win back Canadian travelers?
Destinations like Las Vegas and New York are introducing targeted incentives, such as "Canadian dollar at par" hotel discounts, special promotional packages, and dedicated regional marketing campaigns.
Related Travel Guides
Disclaimer
This article is for informational and educational purposes only. It does not constitute legal, financial, or professional advice. While we strive to provide accurate and up-to-date information, travel policies, regulations, and conditions change rapidly. Always verify information with official sources before making travel decisions. Nomad Lawyer makes no representations about the accuracy, reliability, completeness, or suitability of the information provided. Readers should consult qualified professionals for advice specific to their circumstances. The views expressed in this article are those of the author and do not necessarily reflect the views of Nomad Lawyer.
Kunal K Choudhary
Co-Founder & Contributor
A passionate traveller and tech enthusiast. Kunal contributes to the vision and growth of Nomad Lawyer, bringing fresh perspectives and driving the community forward.
Learn more about our team →