
US City Hotel Occupancy Slump 2026: New Orleans, Las Vegas, and Tampa Face Softening Demand

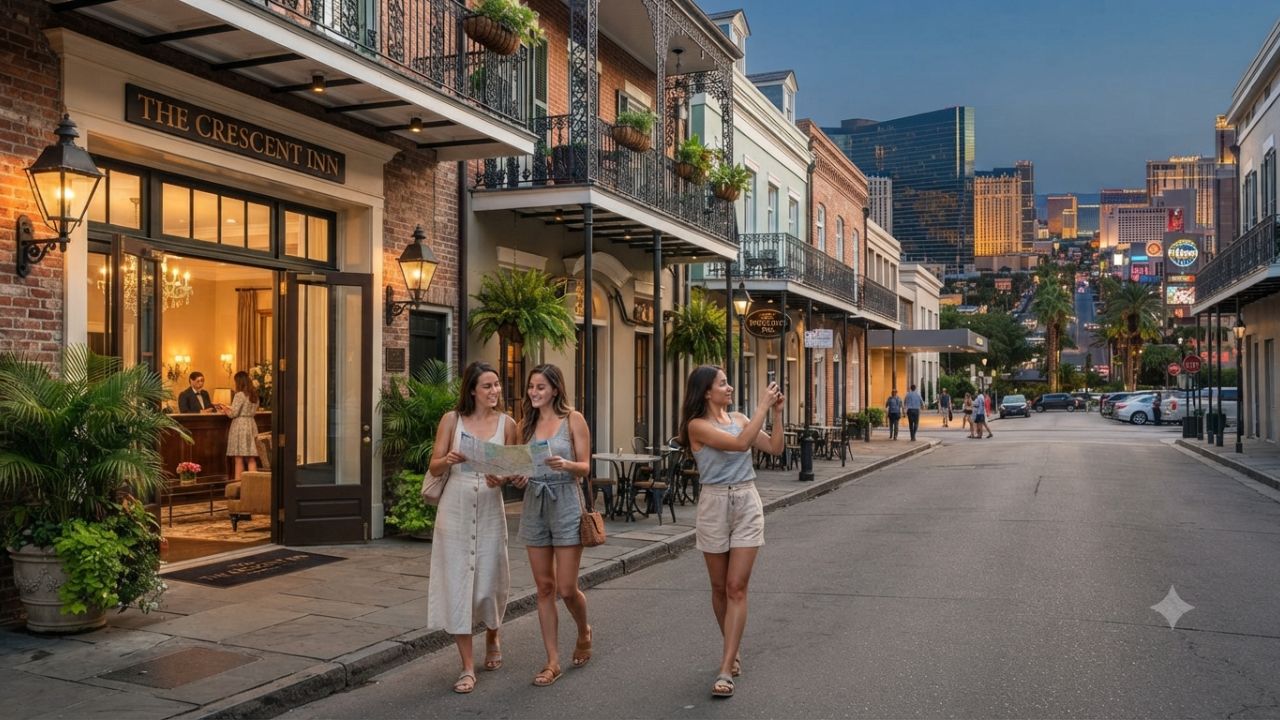
Late summer 2026 US hotel performance reveals sharp city-level polarization as major markets like New Orleans and Las Vegas face room demand headwinds.
Major metropolitan hotel markets across the United States experienced an uneven end to the summer 2026 travel season, as key urban destinations faced notable room demand declines. Industry benchmark data for August 2026 shows that while national average occupancy remained slightly positive, cities including New Orleans, Las Vegas, and Miami recorded significant occupancy compressions that are reshaping hospitality pricing strategies, convention planning, and citywide tourism forecasts.
August 2026 US Hotel Benchmark Performance Data
[NEW ORLEANS, October 4, 2026] — National hotel performance data for August 2026 indicates that overall US hotel occupancy averaged 66.4 percent, representing a minimal 0.5 percent year-on-year increase compared to August 2025. Across all US lodging properties, the Average Daily Rate (ADR) reached $161.78 (+1.5 percent YoY), while Revenue Per Available Room (RevPAR) rose 2.0 percent to $107.43.
However, the modest national annual gain concealed substantial month-on-month pullbacks and extreme city-to-city divergence. Compared to July 2026—which benefited from summer holiday travel, school vacations, and major sporting events—August national occupancy fell 4.7 percent, ADR dropped by $9.96 per night, and RevPAR contracted 10.3 percent.
| City / Market | Timeframe | Occupancy Rate | YoY Change | Key Performance Summary & Driver Factors |
|---|---|---|---|---|
| National US Average | Full Month August | 66.4% | +0.5% | ADR $161.78 (+1.5%); RevPAR $107.43 (+2.0%); MoM RevPAR fell 10.3% |
| New Orleans, LA | Full Month August | 43.3% | -7.7% | Lowest occupancy among Top 25 US markets; RevPAR dropped 9.0% to $51.63 |
| New Orleans, LA | Week 23–29 August | 40.6% | -14.9% | Weakest single-week city result; RevPAR down 18.4% to $47.50 (event shift impact) |
| Las Vegas, NV | Week 16–22 August | 60.0% | -17.4% | Steepest weekly occupancy decline in Top 25; RevPAR plunged 20.0% to $95.15 |
| Las Vegas, NV | Wk 26 Jul–1 Aug | 66.2% | -11.7% | Led major US markets in weekly occupancy, ADR, and RevPAR contractions |
| Miami, FL | Week 2–8 August | 65.8% | -7.2% | Lowest weekly occupancy drop among named Florida hubs; RevPAR down 8.5% to $107.60 |
| Tampa, FL | Week 9–15 August | 64.9% | +11.7% | Stood below 68.0% national weekly average, but demand surged YoY via concert & conference traffic |
| St. Louis, MO–IL | Week 16–22 August | 66.8% | +10.5% | Near national average; boosted by BMW Championship golf tournament attendance |
| Nashville, TN | Week 2–8 August | Unreleased | Unreleased | Recorded largest Top 25 ADR decline, dropping 4.1% year-on-year to $158.12 |
| San Francisco, CA | Full Month August | 79.3% | +6.6% | Top performing major US market; ADR rose 8.7% to $216.77; RevPAR surged 15.8% to $171.84 |
New Orleans: Lowest Occupancy Performer Among Major US Markets
New Orleans recorded the lowest full-month occupancy figure specifically identified among the 25 largest US hotel markets in August 2026. The Louisiana city registered a room occupancy rate of just 43.3 percent, marking a 7.7 percent drop compared to August 2025 and trailing the national average by 23.1 percentage points.
The city's RevPAR fell 9.0 percent year-on-year to $51.63, confirming that hoteliers faced simultaneous pressure on volume and rate realization.
Performance deteriorated further toward the end of the month:
- August 23–29 Weekly Occupancy: Dropped to 40.6 percent, down 14.9 percent from the matching 2025 calendar week.
- Weekly RevPAR: Declined 18.4 percent to $47.50.
Industry analysts emphasize that event calendar timing significantly distorted the late-August comparisons. In 2025, the major Southern Decadence festival fell during the corresponding late-August week, whereas calendar variations shifted event-driven visitor stays in 2026.
Additionally, August represents one of the hottest, most humid periods in the Gulf Coast region, combining with peak Atlantic hurricane season vigilance to temper short-haul leisure bookings outside major holiday weekends.
Las Vegas: Steep Mid-August Room Demand Compression
Las Vegas, operating one of the densest resort and hotel room concentrations globally, experienced severe single-week performance pullbacks during August:
- Week of August 16–22: Occupancy fell to 60.0 percent, a steep 17.4 percent drop from the same week in 2025. RevPAR plunged 20.0 percent to $95.15—the sharpest weekly decline recorded among Top 25 US markets.
- Week of July 26–August 1: Occupancy reached 66.2 percent (-11.7 percent YoY), accompanied by leading market-wide drops in ADR and RevPAR.
Because Las Vegas resort properties depend heavily on large-scale convention scheduling, headline entertainment residencies, and casino gaming volume, minor gaps in major convention alignment or sports event scheduling cause immediate, high-volume drops in occupied room counts. Extreme summer desert heat also restricts outdoor recreation, shifting visitor activity heavily indoors.
For leisure travelers, softer midweek demand in Las Vegas creates tactical booking opportunities, as resorts frequently release room package incentives, dining credits, and lower midweek rate tiers to sustain base occupancy.
San Francisco and Regional Outliers Demonstrate Market Contrast
The August hotel data highlights that US urban room demand did not suffer a uniform national downturn. San Francisco emerged as the top-performing major US hotel market during the month:
- August Occupancy: Reached 79.3 percent, up 6.6 percent year-on-year.
- Average Daily Rate: Increased 8.7 percent to $216.77.
- RevPAR: Surged 15.8 percent to $171.84.
San Francisco's strong growth was fueled by robust international gateway transit, tech conference schedules, and corporate group travel rebounds.
Other regional markets demonstrated event-driven spikes:
- Tampa, Florida: Recorded a 64.9 percent occupancy rate for the week of August 9–15 (+11.7 percent YoY), driven by major concert tours and corporate conventions.
- St. Louis, Missouri: Posted 66.8 percent occupancy for August 16–22 (+10.5 percent YoY), propelled by spectator attendance at the BMW Championship golf tournament.
Broader Economic and Operational Impact on Destination Tourism
Hotel room occupancy serves as a primary leading indicator for municipal tourism health. When hotel occupancy contracts, downstream local economic sectors face proportional headwinds:
- Food and Beverage Expenditure: Lower room density directly reduces evening restaurant seatings, hotel bar revenue, and banqueting bookings.
- Transportation & Ground Mobility: Taxi demand, rideshare volume, and airport transit frequencies decrease during low-occupancy cycles.
- Municipal Lodging Tax Receipts: Declining RevPAR reduces local tax revenues earmarked for city infrastructure, convention center upkeep, and destination marketing campaigns.
- Staffing and Shift Allocations: Hotel operators are forced to adjust operational staffing, reduce seasonal shifts, and optimize housekeeping labor costs.
Strategic Outlook for US City Hotels
As US urban destinations transition into autumn, hotel revenue managers are shifting strategies toward corporate meetings, association conventions, and weekend festival programming. To counter late-summer lulls, destinations like New Orleans and Las Vegas are enhancing midweek group packages and leveraging cruise passenger stays to stabilize room density outside peak weekend windows.
Related Travel Guides
Four Seasons Hotel Philadelphia Appoints Chef Dylan Stage at Jean-Georges
Las Vegas Airport Traffic Drops 9.2% in August 2026 Amid Visitor Volume Slump
Disclaimer
This article is for informational and educational purposes only. It does not constitute legal, financial, or professional advice. While we strive to provide accurate and up-to-date information, travel policies, regulations, and conditions change rapidly. Always verify information with official sources before making travel decisions. Nomad Lawyer makes no representations about the accuracy, reliability, completeness, or suitability of the information provided. Readers should consult qualified professionals for advice specific to their circumstances. The views expressed in this article are those of the author and do not necessarily reflect the views of Nomad Lawyer.
Raushan Kumar
Founder & Lead Developer
Full-stack developer with 11+ years of experience and a passionate traveller. Raushan built Nomad Lawyer from the ground up with a vision to create the best travel and law experience on the web.
Learn more about our team →