
Florida and New York Eye Tourism Boost as US Sets Sights on 100 Million International Visitors by 2030
The US travel industry aims to close a 14.8 million visitor gap to reach 100 million international arrivals by 2030, generating $81 billion in extra spending.

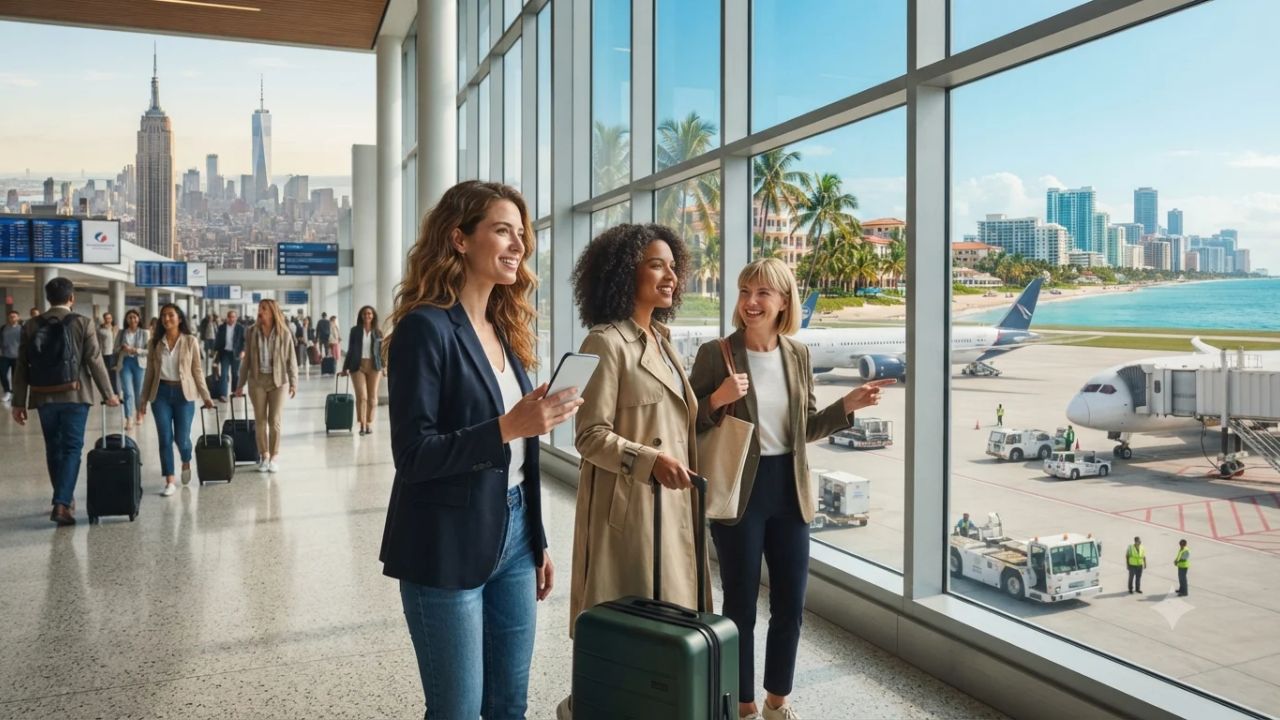
Image generated by AI
A daunting 14.8 million visitor deficit stands between the federal government's baseline forecast and the travel industry's newly unveiled target of attracting 100 million international arrivals annually by 2030. Formulated during a high-level September 2026 White House summit between President Donald Trump, U.S. Travel Association President and CEO Geoff Freeman, and senior travel executives, the 100 million benchmark represents a high-stakes campaign to transform the twin catalysts of the FIFA World Cup 2026 and the America250 semiquincentennial into a permanent economic windfall. While official projections from the National Travel and Tourism Office (NTTO) anticipate 85.2 million foreign travelers entering the country at decade's end, industry leaders argue that closing the gap would unleash $81 billion in incremental visitor spending and generate more than 400,000 domestic jobs. For gateway states like New York, Florida, and California, the initiative demands an aggressive transition from post-pandemic recovery to structural modernization, requiring coordinated overhauls of consular visa processing, international airline seat capacity, and airport border infrastructure.
The Washington Accord: Bridging the 14.8 Million Visitor Gap
The economic calculus presented at the White House underscores a fundamental reality: foreign travelers spend substantially more per journey than domestic vacationers, functioning as an export sector that deposits foreign capital directly into regional economies. In 2024, the United States welcomed 72.4 million international visitors, before arrivals dipped to 68.3 million in 2025. While official NTTO forecasts project a gradual rebound to 70.5 million in 2026 and a record 82.3 million in 2029, the trajectory represents a 25% expansion over five years. By contrast, reaching the industry's 100 million target demands a 46% surge above 2025 baselines.
Tourism strategists view the late 2020s as a rare promotional window. The FIFA World Cup 2026, hosted jointly with Canada and Mexico, will draw hundreds of thousands of international spectators into US host cities, creating unprecedented immediate demand across hospitality, rail, and aviation corridors. Concurrently, the America250 milestone commemorates 250 years of American independence, providing historical epicenters like Philadelphia, Boston, Washington, and New York with a dedicated cultural hook to attract heritage-focused overseas travelers.
However, industry executives cautioned the White House that major international events provide only temporary spikes. Converting one-time tournament attendees into multi-year repeat visitors requires eliminating procedural barriers that historically divert international travelers to competing destinations across Europe and the Middle East. According to policy briefs from the U.S. Travel Association, foreign travelers evaluate destination choices based on consular wait times, airport border processing speed, and transit friction long before booking hotel rooms.
Port of Entry Dynamics and the Asymmetric Asian Recovery
International traveler distribution across the United States remains concentrated within three dominant coastal gateways. Official arrival data from 2024 establishes New York City as the nation's premier port of entry, processing more than 6.1 million overseas travelers through its metropolitan airport system. Miami followed as the second-largest international gateway, handling over 4.75 million overseas visitors driven by Latin American commerce and cruise departures. Los Angeles ranked third, recording more than 3.36 million overseas arrivals, serving as the essential transpacific bridge for Asian and Oceanic travelers.
For these primary hubs, the pathway to 100 million arrivals depends heavily on repairing severely lagging source markets in the Asia-Pacific region. While Indian visitation expanded rapidly, surging to 149% of its 2019 pre-pandemic benchmark by 2024, East Asian markets remain severely depressed. South Korea reached just 74% of 2019 arrival volumes, China lingered at 57%, and Japan stood at an alarming 49%. Overcoming this regional shortfall while maintaining growth across established source nations like the United Kingdom, Canada, Mexico, Germany, France, and Brazil forms the core requirement for closing the 14.8 million arrival shortfall.
| Calendar Year | Official NTTO Arrivals Forecast | Projected Annual Growth | Industry Target Benchmark | Growth Variance vs Target |
|---|---|---|---|---|
| 2024 | 72.4 million | Historical baseline | N/A | Completed baseline |
| 2025 | 68.3 million | -5.7% (Correction) | 68.3 million | Post-surge stabilization |
| 2026 | 70.5 million | +3.2% | World Cup & America250 Kickoff | +2.2 million baseline gain |
| 2027 | 74.1 million | +5.2% | Post-event retention phase | Legacy conversion window |
| 2028 | 78.7 million | +6.1% | Olympic runway build-up | Mid-decade expansion |
| 2029 | 82.3 million | +4.6% (New record) | Sustained growth push | Breaks historical peak |
| 2030 | 85.2 million | +3.5% | 100.0 million | 14.8 million arrival gap |
| Port of Entry / Metro Hub | 2024 Overseas Arrivals | Primary Source Corridors | Strategic Conversion Priority |
|---|---|---|---|
| New York City (JFK / EWR) | Over 6.10 million | Western Europe, Transatlantic, Global | Dispersing visitors to Hudson Valley, Niagara, and Finger Lakes |
| Miami Metropolitan Area (MIA) | Over 4.75 million | Latin America, Caribbean, Europe | Linking cruise traffic to Orlando theme parks and the Florida Keys |
| Los Angeles Gateway (LAX) | Over 3.36 million | East Asia, Oceania, Transpacific | Capturing long-haul Asian recovery and multi-park state circuits |
| International Source Market | 2024 Recovery Level (% of 2019 Baseline) | Market Classification | Primary Structural Barrier |
|---|---|---|---|
| India | 149% | High-growth outperformer | Consular B1/B2 visa interview appointment backlogs |
| South Korea | 74% | Lagging recovery | Currency exchange volatility and economic headwinds |
| China | 57% | Severely depressed | Bilateral air service limits and geopolitical frictions |
| Japan | 49% | Deep structural contraction | Historic yen weakness against the US dollar |
Expert Analysis: Border Friction, Consular Mechanics, and Multi-State Yield
For travelers booking these routes, the direct consequence is that the United States is competing in a global tourism marketplace where ease of entry dictates final destination choices. The primary structural bottleneck impeding the 100 million visitor target is not destination marketing, but administrative friction administered through the U.S. Department of State and border security checkpoints. When prospective visitors in high-growth corridors face excessive interview wait times for standard B1/B2 visitor visas, they redirect their leisure capital to visa-free or e-visa jurisdictions across Europe, Southeast Asia, and the Caribbean.
The pricing pressure this creates means American metropolitan hotels and regional airlines bear the cost of delayed international arrivals. An international visitor stays an average of three times longer and spends nearly four times as much as a domestic weekend traveler. In New York, failure to accelerate international arrivals concentrates tourism spending exclusively within midtown Manhattan, denying hospitality operators in the Catskills, Adirondacks, and Hudson Valley the high-yield distribution required to support regional employment.
In Florida, the cause-and-effect relationship centers on length-of-stay extension. Overseas travelers arriving through Miami International Airport historically disperse into Central Florida attractions or coastal cruise terminals. If immigration processing times at border gates remain cumbersome, international transit travelers truncate their itineraries, bypassing secondary excursions in Tampa, the Gulf Coast, or the Space Coast. Achieving the $81 billion economic dividend requires seamless multi-state ticketing and modern biometric entry systems that process arriving passengers efficiently. Reaching 100 million visitors requires transforming the American border from an administrative barrier into a streamlined reception gateway.
Key Takeaways
- Ambitious 100 Million Target: Travel industry executives and the White House established an objective of welcoming 100 million international visitors annually by 2030, outperforming the official NTTO forecast by 14.8 million travelers.
- Substantial Economic Dividend: Achieving the 100 million visitor milestone would inject an estimated $81 billion in additional direct visitor spending into the US economy and generate over 400,000 American jobs.
- Mega-Event Launchpads: The FIFA World Cup 2026 and America250 celebrations serve as the primary international catalysts to drive arrivals from 70.5 million in 2026 to new records by 2029.
- Three Gateways Lead Overseas Entries: New York (over 6.1 million), Miami (over 4.75 million), and Los Angeles (over 3.36 million) processed the vast majority of overseas arrivals in 2024.
- Uneven International Recovery: While Indian arrivals reached 149% of 2019 levels in 2024, severe contractions persist in East Asia, with South Korea at 74%, China at 57%, and Japan at just 49%.
FAQ: US International Tourism Target 2026
What is the US travel industry's international visitor goal for 2030?
The US travel industry aims to attract 100 million international visitors annually by 2030, exceeding the government's official forecast of 85.2 million by roughly 14.8 million foreign arrivals.
How much economic revenue would 100 million international visitors generate?
Achieving the 100 million annual visitor threshold would deliver approximately $81 billion in incremental traveler spending and support more than 400,000 jobs across the American economy.
Which US cities process the highest number of overseas arrivals?
In 2024, New York City led the nation with over 6.1 million overseas visitors, followed by Miami with more than 4.75 million, and Los Angeles with over 3.36 million arrivals.
Why are Asian visitor arrivals lagging behind other international markets?
While India surged to 149% of 2019 levels, key markets like Japan (49%), China (57%), and South Korea (74%) lag due to currency depreciation, flight capacity constraints, and visa appointment wait times.
[In the global race for high-spending travelers, setting an ambitious arrival target is simple, but dismantling border friction and visa delays is what determines who actually lands.]
Related Travel Guides
The 10 Best Airline Lounges at New York JFK Airport, According to Reddit (2026 Guide)
The 10 Best Hotels in Las Vegas, According to Reddit (2026 Guide)
The 10 Best International Gateway Airports in the US, According to Reddit
Disclaimer
This article is for informational and educational purposes only. It does not constitute legal, financial, or professional advice. While we strive to provide accurate and up-to-date information, travel policies, regulations, and conditions change rapidly. Always verify information with official sources before making travel decisions. Nomad Lawyer makes no representations about the accuracy, reliability, completeness, or suitability of the information provided. Readers should consult qualified professionals for advice specific to their circumstances. The views expressed in this article are those of the author and do not necessarily reflect the views of Nomad Lawyer.
Raushan Kumar
Founder & Lead Developer
Full-stack developer with 11+ years of experience and a passionate traveller. Raushan built Nomad Lawyer from the ground up with a vision to create the best travel and law experience on the web.
Learn more about our team →