
India Commercial Vehicle Sales Surge 30.7 Percent As Infrastructure And Logistics Demand Drive Strong August Growth
India Commercial Vehicle Sales Surge 30.7 Percent As Infrastructure And Logistics Demand Drive Strong August Growth

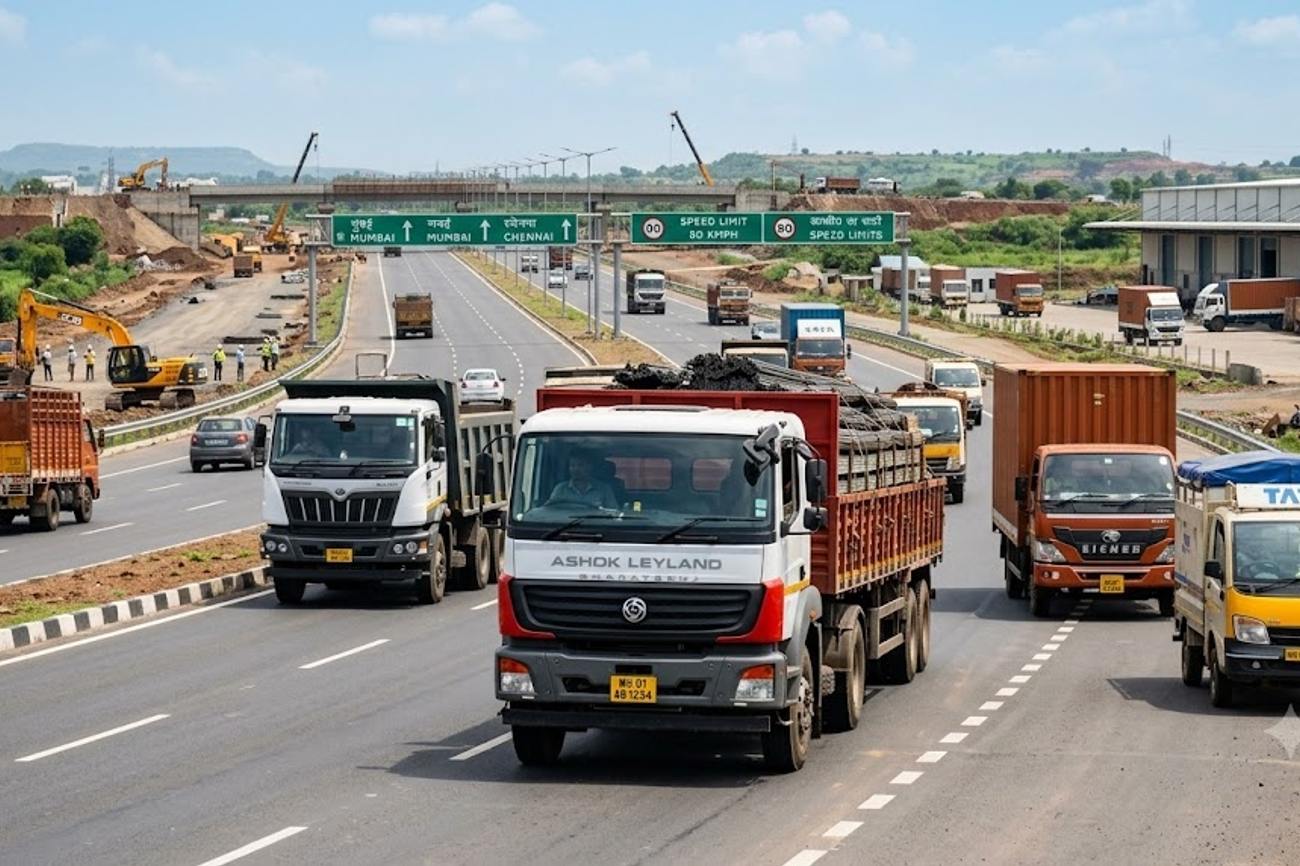
Image generated by AI
[New Delhi, August 2026] — Indian commercial vehicle (CV) wholesale sales surged 30.7% year-on-year in August 2026, marking a significant acceleration in the nation's logistics and industrial transport capacity. This growth represents a 6.8% increase over July 2026 figures and contributes to a broader trend where CV wholesale volumes have expanded by 23.4% year-on-year during the first five months of FY2027.
The surge is driven by a combination of aggressive infrastructure development, expanded mining operations, and a spike in e-commerce logistics requirements. While wholesale numbers show the strongest gains, retail sales are trailing slightly but remain robust, recording a 20.1% year-on-year increase for the month of August. The market is currently benefiting from stable vehicle financing and the lingering positive effects of tax reforms implemented by the Ministry of Finance.
The Drivers of Industrial Growth
The immediate catalyst for this spike is a multifaceted increase in domestic demand. Heavy industry, specifically the cement and steel sectors, has ramped up freight movement, creating an urgent need for more hauling capacity. Simultaneously, the Indian government's continued focus on infrastructure projects has created a sustained requirement for heavy machinery and transport vehicles to move raw materials to construction sites.
A critical policy lever has been the reduction of Goods and Services Tax (GST) rates, which took effect on September 22, 2025. This tax relief lowered the entry barrier for fleet operators and individual owners, triggering a wave of purchases that peaked in late 2025 and continues to support the market into FY2027. These regulatory changes are monitored closely by the Society of Indian Automobile Manufacturers (SIAM), as they directly correlate with the volume of new registrations across the country.
Market Breakdown: LCV vs. M&HCV
The growth is not uniform across all vehicle classes. The market is split between Light Commercial Vehicles (LCVs), which handle last-mile delivery, and Medium and Heavy Commercial Vehicles (M&HCVs), which manage long-haul and industrial freight.
Light Commercial Vehicles (LCV)
- Retail Volume Growth: 21.3% year-on-year in August 2026.
- Sequential Performance: Experienced a 9.2% decline compared to the previous month.
- Primary Drivers: E-commerce expansion and last-mile freight activity.
- Primary Headwinds: Rising ownership costs are offsetting some of the benefits provided by GST reductions.
Medium and Heavy Commercial Vehicles (M&HCV)
- Retail Volume Growth: 18.2% year-on-year in August 2026.
- Sequential Performance: Experienced an 8.6% decline compared to the previous month.
- Primary Drivers: Rural demand, mining, steel, and cement transport.
- Primary Headwinds: High sensitivity to industrial production cycles.
What This Means for Travelers and Logistics
While this data focuses on wholesale and retail sales, the real-world impact for those navigating India's transport landscape is significant. The influx of new vehicles into the ecosystem suggests a shift in how goods and people move across the subcontinent.
For E-commerce Users and Business Travelers: The 21.3% jump in LCV retail volumes indicates a massive expansion in "last-mile" infrastructure. For the end-user, this translates to faster delivery windows and increased reliability for courier services in urban centers. As more LCVs hit the road, the efficiency of the supply chain improves, potentially lowering the cost of goods delivered to the consumer.
For Industrial Investors and Freight Forwarders: The growth in M&HCVs suggests that the "backbone" of Indian logistics is strengthening. With more heavy-duty trucks entering the market, there is increased capacity for bulk transport. However, the sequential decline in sales (8.6% for M&HCVs) suggests that the market may be experiencing a "cooling off" period after the initial rush following the September 2025 GST cuts.
For Regional Commuters: The projected growth in the bus segment (estimated at 3-5% for the fiscal year) suggests a gradual modernization of public and private transit. This may lead to a higher availability of newer, more efficient vehicles on intercity routes, though the pace of this improvement is slower than that of the freight sector.
FY2027 Projections and Market Cooling
Despite the August surge, analysts from ICRA are forecasting a more moderate trajectory for the remainder of the fiscal year. The industry is expected to see an overall wholesale volume growth of 4-6% year-on-year for FY2027. This tempered outlook is primarily due to "base effects"—the fact that the second half of FY2026 saw an extraordinary spike in sales immediately following the GST rate cuts.
When comparing current numbers against that period of extreme growth, the year-on-year percentages are likely to appear lower, even if the market remains healthy. The specific projections for the remainder of the year are as follows:
- LCV Trucks: Expected growth of 6-8%.
- M&HCV Trucks: Expected growth of 1-3%.
- Bus Segment: Expected growth of 3-5%.
The industry is now transitioning from a period of policy-driven growth (tax cuts) to a period of demand-driven growth (infrastructure and e-commerce). The ability of the market to maintain momentum will depend on whether ownership costs can be stabilized and whether the current pace of infrastructure spending continues.
FAQ: India Commercial Vehicle Market 2026
Why did CV sales spike in August 2026? The growth was driven by a 30.7% increase in wholesale sales, fueled by increased mining, steel, and cement freight, alongside expanded e-commerce logistics and infrastructure projects.
How did the GST rate change affect vehicle sales? GST rate cuts implemented on September 22, 2025, lowered the cost of acquisition, leading to a surge in demand that continues to influence retail and wholesale volumes in FY2027.
What is the difference between LCV and M&HCV growth? LCVs saw a higher retail increase (21.3%) driven by last-mile delivery, while M&HCVs grew by 18.2%, supported by heavy industrial freight and rural demand.
Will this growth continue through the end of FY2027? Growth is expected to moderate to 4-6% overall. This is because the high sales volumes from late FY2026 create a difficult comparison base for the second half of the current year.
Industrial capacity is expanding, but the era of easy, tax-driven gains is ending.
#IndiaCV2026 #LogisticsIndia #M&HCV #LCV #ICRA #IndianAutoIndustry
Related Travel Guides
Disclaimer
This article is for informational and educational purposes only. It does not constitute legal, financial, or professional advice. While we strive to provide accurate and up-to-date information, travel policies, regulations, and conditions change rapidly. Always verify information with official sources before making travel decisions. Nomad Lawyer makes no representations about the accuracy, reliability, completeness, or suitability of the information provided. Readers should consult qualified professionals for advice specific to their circumstances. The views expressed in this article are those of the author and do not necessarily reflect the views of Nomad Lawyer.
Naina Thakur
Contributor & Travel Specialist
Travel enthusiast and legal writer covering visa regulations, responsible tourism, and cultural journeys across global destinations.
Learn more about our team →