
Global Cruise Port Bottlenecks Create 70% Revenue Leakage Across New Zealand, Japan, Saudi Arabia, and Norway
Cruise destinations face severe land-side infrastructure bottlenecks, with up to 70% of onshore spend leaking to international booking channels.

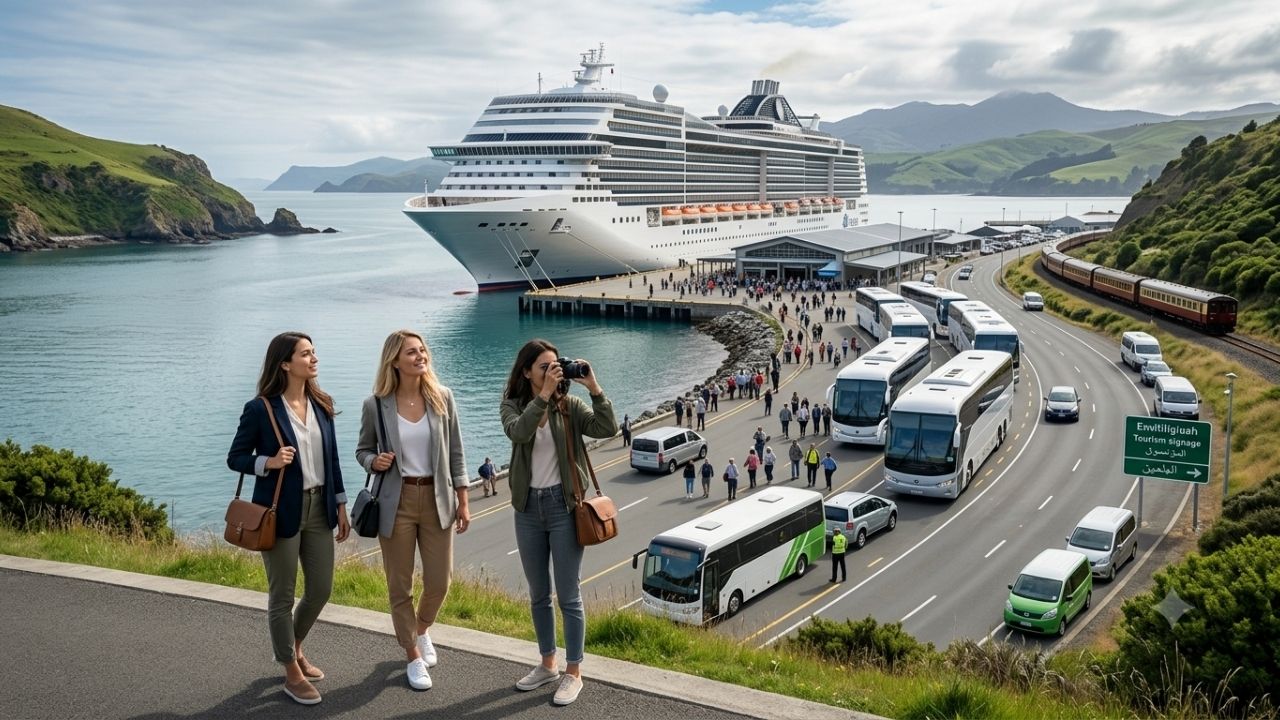
Image generated by AI
Rising passenger volumes at secondary cruise ports across New Zealand, Japan, Saudi Arabia, and Norway are exposing severe land-side transport bottlenecks and 70% economic leakage.
[WELLINGTON, New Zealand] — Maritime trade and tourism disclosures reveal a growing operational mismatch between cruise ship berthing capacity and land-side transport infrastructure. As maritime nations advance economic targets to expand international travel revenue, disembarking mega-vessels into smaller regional ports creates severe ground congestion. Financial analysis shows that up to 70% of passenger spending leaks to international booking intermediaries, leaving host communities to shoulder municipal maintenance costs while capturing minimal direct economic yield.
Global Case Studies: Strategic Growth Targets Versus Regional Ground Realities
National tourism strategies around the globe face structural constraints when managing high-volume maritime arrivals at secondary regional gateways.
Global Cruise Strategy Horizon Overview:
├── New Zealand (Target 2034): Double export value to NZ$19.8B (4.78M annual arrivals)
├── Japan (Vision 2030): Target 60M annual visitors & ¥15T spend (60% secondary port calls)
├── Saudi Arabia (Vision 2030): 150M visitors target (Red Sea & Arabian Gulf hubs)
└── Norway (2026/2032 Mandates): Zero-emission rules in UNESCO fjords (Geiranger & Flåm)
| Nation | Target Horizon & Strategic Goal | Primary Cruise Growth Focus | Core Regional Land-Side Bottleneck |
|---|---|---|---|
| New Zealand | Target 2034: Double export value to NZ$19.8B | Secondary ports (Tauranga, Napier, Dunedin) | Severe tour coach shortages & heritage rail caps |
| Japan | Vision 2030: 60M visitors & ¥15T spend | Secondary regional calls (Kanazawa, Ishigaki, Kochi) | Guide interpreter shortages & driver hour limits |
| Saudi Arabia | Vision 2030: 150M visitors & 10% GDP share | Red Sea and Arabian Gulf cruise expansion | Rapid capital demand for desert transit to AlUla |
| Norway | 2026/2032 Mandate: Net-zero UNESCO fjords | Fjord calls (Geiranger, Flåm, Aurlandsfjord) | Grid capacity for shore power & road bottlenecks |
New Zealand (Aotearoa): NZ$19.8 Billion Target Meets Tour Coach Deficits
New Zealand’s Ministry of Business, Innovation and Employment targets doubling international travel export value from NZ$9.9 billion in 2023 to NZ$19.8 billion by 2034 under the Tourism Growth Roadmap.
While international arrivals recovered to 3.51 million in 2025 toward a 2034 goal of 4.78 million, regional cruise ports face acute coach deficits.
At Tauranga, disembarking 4,000 passengers requires 64 coaches for a 50% excursion rate, but local fleets supply only 35 vehicles, creating a 45% deficit (-29 coaches).
In Dunedin (Port Otago), track maintenance backlogs on the historic Taieri Gorge Railway cap high-yield inland excursions (NZ$180–NZ$350 per passenger), leaving thousands of visitors confined to low-spending port walks (NZ$20–NZ$50).
New Zealand Tourism Roadmap Metrics (Target 2034):
├── Export Value Target: NZ$9.9 Billion (2023) ➔ NZ$19.8 Billion (2034 Target)
├── Annual Visitor Target: 2.96 Million (2023) ➔ 3.51 Million (2025 Actual) ➔ 4.78 Million (2034 Target)
└── Tauranga Coach Deficit: 35 Available vs 64 Required (-29 Coaches / -45% Deficit)
Japan's Vision 2030: Rural Labor Shortages and Driver Hour Limits
Japan's cabinet Vision 2030 targets 60 million annual international visitors and ¥15 trillion in visitor spend by 2030, aiming for secondary ports to handle over 60% of total cruise calls.
However, calling at secondary ports like Kanazawa, Ishigaki, Kochi, and Sakaiminato runs into severe rural labor deficits.
Kanazawa faces a 34% coach deficit (40 available vs 61 required for 3,800 passengers).
Strict commercial driver hour limits and a shortage of licensed guide-interpreters (全国通訳案内士) force operators to run basic shopping mall shuttles rather than high-yield regional tours.
Japan Vision 2030 Secondary Port Indicators:
├── Annual Visitor Target: 31.8 Million (2019/23) ➔ 60.0 Million (2030 Target)
├── Total Spend Target: ¥4.8 Trillion (2019/23) ➔ ¥15.0 Trillion (2030 Target)
└── Kanazawa Transport Gap: 40 Available Coaches vs 61 Required (-21 Coaches / -34% Deficit)
Saudi Arabia's Red Sea Expansion and Norway's Decarbonization Mandates
Saudi Arabia's revised Vision 2030 roadmap targets 150 million annual domestic and international visitors and a 10% GDP contribution, expanding Red Sea cruise hubs at Jeddah, Yanbu, and Dammam under Cruise Saudi.
At Yanbu, a 51% coach deficit (25 available vs 51 required for 3,200 passengers) limits desert excursions to UNESCO heritage sites like AlUla and Al-Balad.
In Norway, the Storting mandated zero direct carbon emissions in UNESCO fjords (Geirangerfjord, Nærøyfjord, Aurlandsfjord) for vessels under 10,000 Gross Tonnage starting January 1, 2026, and larger ships by January 1, 2032.
In Geiranger (population <300), a single 4,000-passenger ship causes a tenfold population surge. With only 12 electric coaches available against 67 required (-82% deficit), grid infrastructure limits shore power and EV charging.
Norway Fjord Emission Mandate Dates:
├── Jan 1, 2026: Mandatory zero direct carbon emissions for vessels <10,000 Gross Tonnage
├── Jan 1, 2032: Mandatory zero direct carbon emissions for vessels ≥10,000 Gross Tonnage
└── Geiranger Coach Deficit: 12 Electric Coaches vs 67 Required (-55 Coaches / -82% Deficit)
| Destination Port | Available Regional Coaches | Ship Passenger Capacity | Required Coaches (50% Excursion) | Immediate Regional Coach Deficit |
|---|---|---|---|---|
| Tauranga (New Zealand) | 35 Coaches | 4,000 Passengers | 64 Coaches | -29 Coaches (-45% Deficit) |
| Kanazawa (Japan) | 40 Coaches | 3,800 Passengers | 61 Coaches | -21 Coaches (-34% Deficit) |
| Yanbu (Saudi Arabia) | 25 Coaches | 3,200 Passengers | 51 Coaches | -26 Coaches (-51% Deficit) |
| Geiranger (Norway) | 12 Electric Coaches | 4,200 Passengers | 67 Coaches | -55 Coaches (-82% Deficit) |
Quantitative Economic Modeling: Spend Gaps and Cold Ironing Capital Costs
Economic modeling highlights a sharp financial gap between transit and turnaround passengers:
- Transit Passengers: Spend $70–$150 USD per day onshore, but 50%–70% leaks to international cruise lines and booking aggregators as commissions, leaving only 30%–50% retained locally.
- Turnaround Passengers: Spend $350–$600 USD per stay, with 70%–85% retained by local hotels, restaurants, and taxis.
Installing shore power (cold ironing) requires $8 million to $40 million USD per berth (£6.6M–€37M+), needing 10 MVA–20 MVA electrical grid headroom and static frequency converters (50 Hz to 60 Hz).
Annual operation and maintenance costs average 5% of initial capital expenditure.
Cruise Passenger Economic Retention Matrix:
├── Transit Passenger: $70–$150 USD/day spend | 50%–70% Leakage | 30%–50% Retained Locally
├── Turnaround Passenger: $350–$600 USD/stay spend | 15%–30% Leakage | 70%–85% Retained Locally
└── Shore Power Installation Cost: $8M–$40M USD (£6.6M–€37M+) per berth | 5% Annual O&M
| Passenger Category | Average Onshore Spend | Primary Spend Allocation | Economic Leakage Rate | Local Retention Rate |
|---|---|---|---|---|
| Transit Passenger | $70 USD – $150 USD / day | Excursions, souvenirs, light F&B | 50% – 70% (High Leakage) | 30% – 50% Retained Locally |
| Turnaround Passenger | $350 USD – $600 USD / stay | Hotels, fine dining, flights, taxis | 15% – 30% (Low Leakage) | 70% – 85% Retained Locally |
| Time Period | Pressure Level | Key Operational & Infrastructure Impacts |
|---|---|---|
| 07:00 AM – 10:00 AM | Early Arrival Phase | Passenger disembarkation begins; transport queues form |
| 10:00 AM – 01:00 PM | Peak Crush Period (75%–100%) | Heavy overcrowding; transport capacity exhausted; site pressure |
| 01:00 PM – 05:00 PM | Recovery Phase | Passenger return to ship; congestion decreases |
| After 05:00 PM | Low Pressure Period | Normal destination activity resumes |
Frequently Asked Questions (FAQ)
Q1: What is the main cause of the cruise tourism yield gap?
A: Up to 70% of transit passenger spending leaks to international cruise lines and booking platforms, while local coach shortages confine remaining spending to port precincts.
Q2: How do Norway's fjord emission mandates affect cruise ships?
A: Norway requires zero direct emissions for vessels under 10,000 GT starting Jan 1, 2026, and all cruise ships starting Jan 1, 2032, requiring shore power and electric transport fleets.
Q3: What is the cost of installing shore power (cold ironing) at cruise berths?
A: Shore power installations cost between $8 million and $40 million USD per berth (£6.6M–€37M+), plus annual maintenance costs averaging 5% of capital expenditure.
Why This Matters for Passengers, Municipalities, and Port Authorities
Analyzing global cruise port bottlenecks provides key operational insights:
- For Cruise Passengers: Booking independent local tours early ensures access to limited regional transport fleets.
- For Coastal Municipalities: Implementing local sourcing rules on excursions retains a higher share of passenger spending locally.
- For Port Authority Engineers: Upgrading electrical grid capacity to support 10–20 MVA shore power ensures compliance with zero-emission mandates.
Related Travel Guides
Disclaimer
This article is for informational and educational purposes only. It does not constitute legal, financial, or professional advice. While we strive to provide accurate and up-to-date information, travel policies, regulations, and conditions change rapidly. Always verify information with official sources before making travel decisions. Nomad Lawyer makes no representations about the accuracy, reliability, completeness, or suitability of the information provided. Readers should consult qualified professionals for advice specific to their circumstances. The views expressed in this article are those of the author and do not necessarily reflect the views of Nomad Lawyer.
Raushan Kumar
Founder & Lead Developer
Full-stack developer with 11+ years of experience and a passionate traveller. Raushan built Nomad Lawyer from the ground up with a vision to create the best travel and law experience on the web.
Learn more about our team →